| Corcoran Technical Trading Patterns For June 19 |
| By Clive Corcoran |
Published
06/19/2009
|
Stocks
|
Unrated
|
|
|
|
Corcoran Technical Trading Patterns For June 19
Today’s column will focus largely on Ichimoku charts for several sectors and indices which are at critical levels. There are, as with all techniques in TA, layers of complexity associated with the interpretation for this Japanese inspired charting methodology. I want to be simple at this point and focus on the notion that when prices enter the clouds - either pink or green - this is indicative of trend transition and that when price exits from a cloud this is validation of a significant directional change.
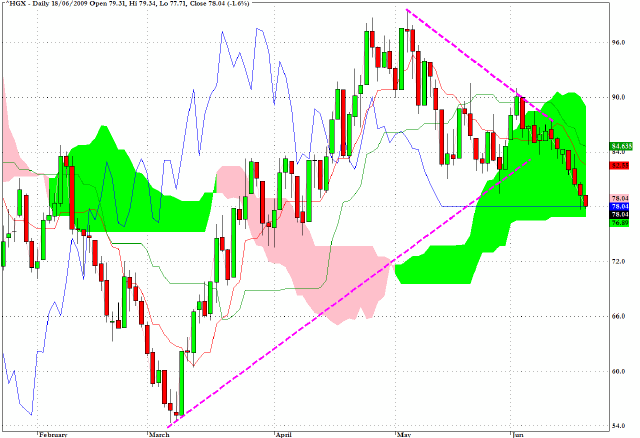
The Housing Index (HGX) is now on the critical level at the bottom of the green cloud and if there is to be a rescue effort mounted by Johnny come lately bulls for the sector, now is the time it should arrive.
Other technical analysis tools suggest that this is looking unlikely.
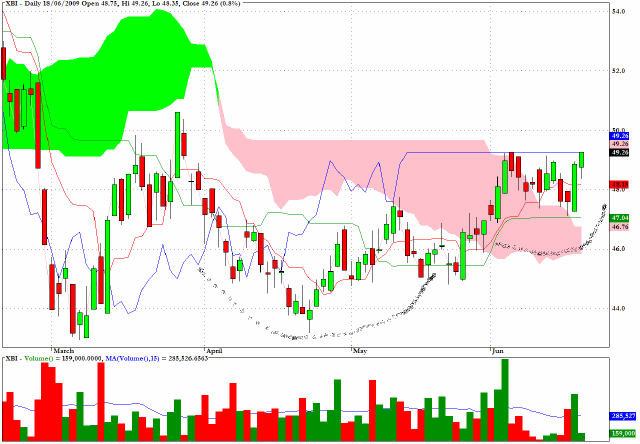
XBI provides a contrasting picture from an Ichimoku perspective and as is often the case there are other technically supportive factors for a diagnosis.
At the beginning of June prices failed to penetrate through the top of the pink cloud from below and then retreated back into the cloud. Over the last few sessions, as the level of the top of the cloud has been declining, it is now clear that price is breaking away from the cloud.
Lending further support to an interpretation that a medium-term bullish trend is now emerging, is the discernible cup and handle formation, which has also been annotated on the chart. This pattern is also often a precursor to bullish breakaway price action.
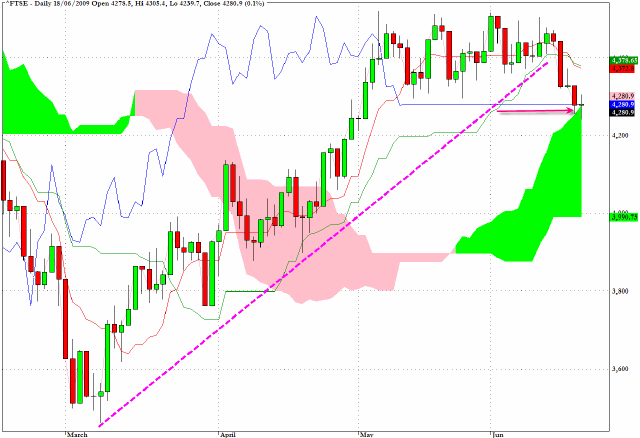
The chart for the FTSE 100 reveals another useful feature of the Ichimoku charting technique which, once again, conforms well with some other more traditional technical analysis indicators.
The UK benchmark index settled Thursday’s session at exactly 4280. Without wanting to appear too clairvoyant, this was precisely the level which I suggested would need to be tested in my column published Tuesday morning.
The revealing aspect of the chart below shows that the top of the green cloud, which according to standard Ichimoku interpretation should provide an initial support, is also at 4280.
Not entirely un-coincidental is the fact that the 50-day EMA for the FTSE is also at 4280!
Across many asset classes, the last few days have seen a probing of major support levels, and longer-term direction will remain ambiguous until the outcome of this testing is fully resolved.
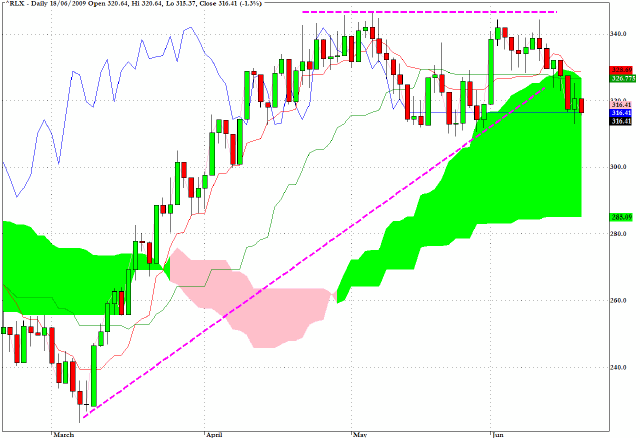
The S&P Retail Index (RLX) is now in the midst of a cloud after failing to find support at the top of the green cloud at the 326 level which also marked the critical level in terms of the violation of the uptrend line from the March low.
According to the Ichimoku analysis, the sector could retreat to the 285 level (bottom of the green cloud) before there is a definitive validation of a new downtrend pattern.
In terms of playing this interpretation one could take the view that this level will be tested and that from the perspective of playing the short side, the 285/90 level would be a valid profit target and the 328 level (i.e. just above the top of the cloud) would be a suitable stop loss level.
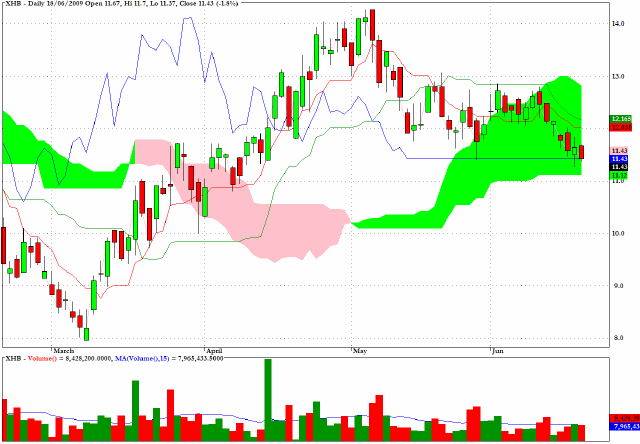
XHB, an exchange traded fund which tracks the homebuilding sector, and which I discussed here earlier this week faces a key test at $11.12 (i.e. the bottom of the green cloud) and a break below would validate a new bearish trend interpretation.
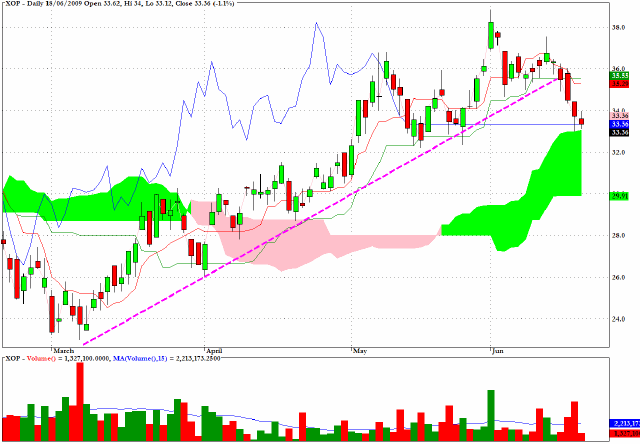
XOP is an ETF for oil exploration sector, and in accordance with the interpretations being offered so far, the traditional TA analysis would suggest that key support has been broken. However yesterday’s close brought the price down to a test of potential support at the top of the green cloud.
Once again any further movement into the cloud should be monitored closely in coming sessions.
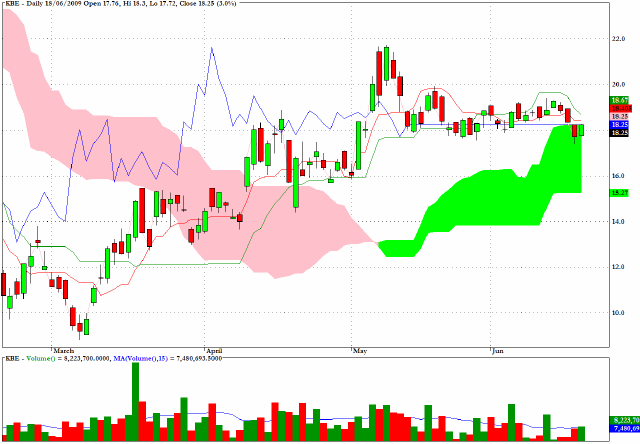
The exchange traded fund the KBW Banking Index (KBE) also has similar characteristics to the chart for XOP.
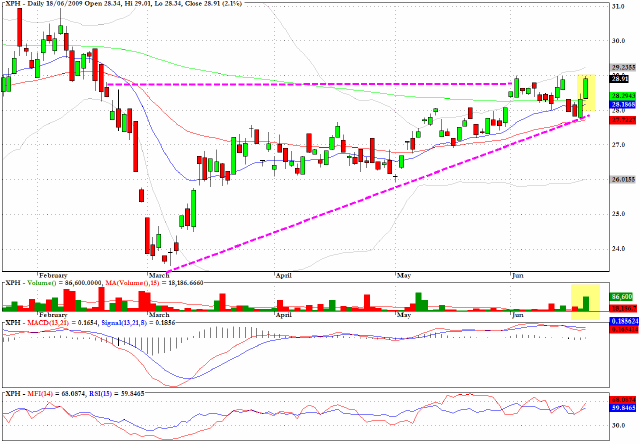
A surge in volume emerged yesterday, in conjunction with a technically bullish wedge pattern, on the chart for XPH which is an exchange traded fund tracking the pharmaceuticals.
Clive Corcoran is the publisher of TradeWithForm.com, which provides daily analysis and commentary on the US stock market.
|