NASDAQ COMMENTARY
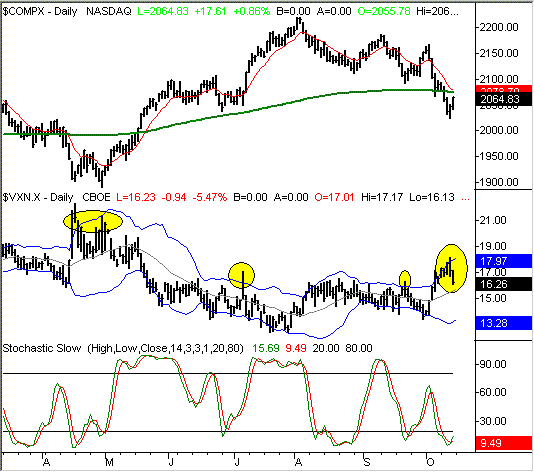
The roller coaster ride continued this week for the NASDAQ, with the index falling as low as 2025.58 before ending the week at 2064.83. But still, after the first half of the week, the composite closed 25.5 points under the prior week's close. That's a 1.2 percent loss. But, the last two days of the week are a bullish red flag that the sellers are done for the time being.
That's an important distinction to make - that it's only a preliminary sign of bullishness. The fact of the matter is that the NASDAQ still closed under all of its key moving averages. From a purely disciplined approach, the trend is still bearish. We can't actually get bullish until the 10 day line (red) and the 200 day line (green) are crossed. They're both between 2075 and 2080, so we may not have to wait all that long until we get the confirmation that the buyers are serious this time around.
From a sentiment perspective, however, the tide has already turned. We've been following the NASDAQ Volatility Index (VXN) for a couple of weeks here, but it wasn't until Friday that we finally got a strong reversal pattern. That's highlighted on the chart below. As you can see, these peaks have been pretty good indications of market bottoms, and signals of a bullish move. That's why we feel a little more optimistic about an upside move soon, even though the moving averages are still above the index.
From here, we may as well wait for the move above 2080 before jumping in. It's only 15 points away, which is a small price to pay for a little extra assurance that this bullish move is going to get traction.
NASDAQ CHART - DAILY

S&P 500 COMMENTARY
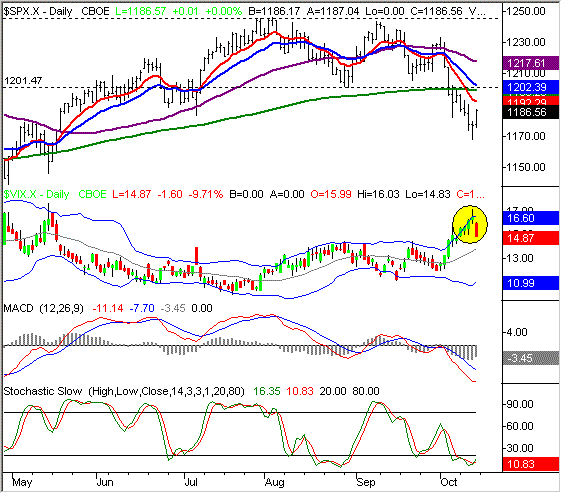
The S&P 500 ended the week about 0.8 percent lower, losing 9.34 points to close at 1186.56. Although still in the hole from the previous Friday, that's a lot better than the low of 1168.20 we saw on Thursday. The story here is the same as the NASDAQ's - the bottom was probably made on Thursday, but we need to clear some technical hurdles before we can get fully bullish. For that reason, we'll be brief with our take on the SPX chart.
Much like the NASDAQ's Volatility Index, the S&P 500 Volatility Index (VIX) shows a sharp peak that coincides with a bottom for the SPX. The VIX fell from 16.47 to 14.87 on Friday, after reaching as high as 17.19 on Thursday. In raw numbers that may not seem like much, but it's a huge change for the VIX. In fact, it's about the biggest drop we've seen in the VIX in months. It's also worth noting that the last two times we saw drops like that for the VIX, it was a setup for a major upside move in the market (May 16th, July 7th). It's still too soon to say that this time will be a repeat, but the current chart looks an awful lot like those two instances, where the VIX was very high, and the market had been through a rather rough patch. Throw in the fact that we are stochastically oversold, and you just get a whole lot of upside pressure. Now it's being unleashed.
The only other thing we can add is something that's not on the chart - the number of NYSE new lows from Wednesday. There were 324 new lows made that day, which is a monster number......it's also a bullish number. Why? Just think of it as a mini-capitulation. After taking a strong hit over the prior week and a half, anybody who was on the fence had finally had enough by the middle of last week. They all got off the fence in one final blow, leaving nobody behind but the buyers. The last time we saw new lows to that degree was in May 2004, which came right in front of a big move. We saw similar new lows in February of 2003 as well, which technically ended up being the beginning of this bull market. So, to see the sellers completely exhaust themselves has historically been a bullish event.....since everything has its limits.
S&P 500 CHART - DAILY

DOW JONES INDUSTRIAL AVERAGE COMMENTARY
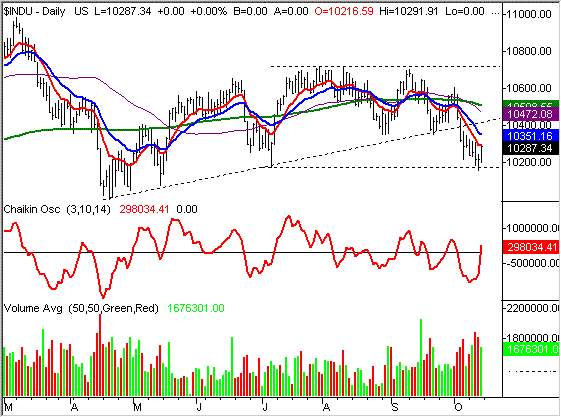
The Dow Jones Industrial Average closed at 10287.34 last week, just five points under the prior week's close. So from a sheer recovery/strength perspective, the Dow has again earned the top spot. Once again, it was Friday's rally that kept the index in the hunt, and out of trouble. And like the other indexes, we see some significant bullish chart patterns on the horizon.
The 10175 mark ended up being the catalyst for the Dow. That was the support we mentioned in the previous write-up, as it was the low we saw in July before stocks made an upside explosion. The Dow had actually been as low as 10156 on Thursday, but for the large numbers this index is measured in (tens of thousands), that's close enough to call it even.
But that's not even why we're bullish here. The most bullish part of this chart is the Chaikin line cross over the zero level we saw on Friday. That verifies that the volume trend is actually bullish, even if the momentum trend is still bearish. Remember, volume tends to lead the market, so we want to note when it's changing direction.
But like all the indexes, the Dow is still under all the key moving averages. In fact, it's parked right at the 10 day line (red) right now. Even with just a little bullishness early next week, we could pretty easily get a short-term buy signal above and beyond the Chaikin signal.
DOW JONES INDUSTRIAL AVERAGE CHART - DAILY

Price Headley is the founder and chief analyst of BigTrends.com.