| Corcoran Technical Trading Patterns For June 22 |
| By Clive Corcoran |
Published
06/21/2009
|
Stocks
|
Unrated
|
|
|
|
Corcoran Technical Trading Patterns For June 22
Futures are pointing to a lower open for US stocks on Monday and European markets are down about 1.5% as this is being written.
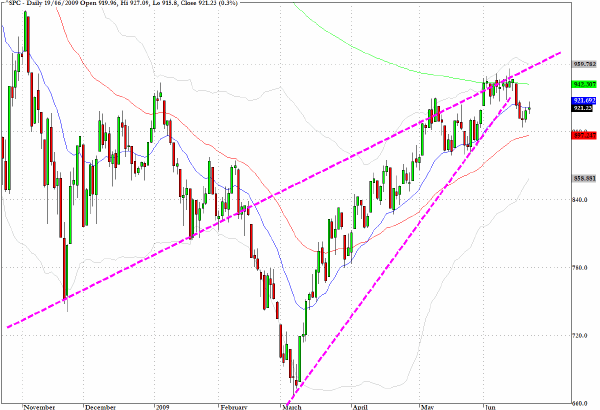
In early May I advanced the view that there was a rising wedge pattern on the S&P 500 and believed that a breakout of that pattern would be a bearish development for the broad market. I also proposed that the 945 level on the index would be a major hurdle. I have turned out to be approximately right on the 945 hurdle as the area within a few points of this target level has proven to be a fairly stiff barrier for the index.
On the rising wedge pattern, in one sense I was wrong since the break below which is indicated on the chart has not (yet) brought out the bears and the index has essentially moved sideways for several sessions.
There is a pullback pattern emerging on the index and there could well be a rally which takes us back to test the highs from early June, allowing fund managers to engage in some window dressing for the end of the quarter and mid-year point.
However, the index is looking less sure of itself than it has for some time, and the possibility of a sudden drop is increasing. I would identify the early July time frame as potentially troubling and would suggest that monitoring the VIX levels in coming sessions could provide some useful clues as to near-term direction.
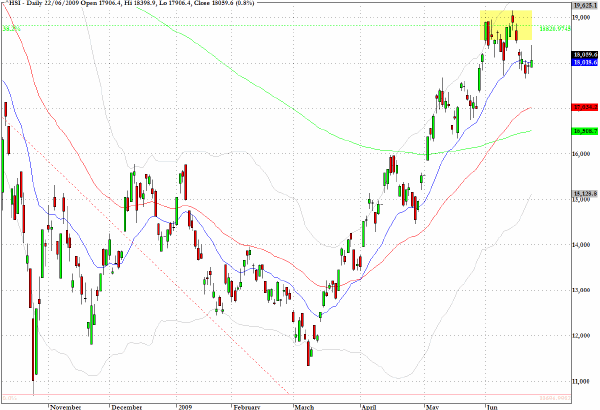
The Hang Seng index (HSI) slumped in afternoon trading in Hong Kong on Monday. As can be seen from the chart below, the intraday high has left a long upper shadow or tail to today’s candlestick.
The dotted green line at the top of the chart traces the 38% retracement level for the peak in the market seen in October 2007 and the base seen one year later.
Highlighted in yellow is the price behavior at this key fibonacci retracement level and the swift drop which took place after the index peeked above 19,000 indicates that there is likely to be more consolidation in the current price zone with a potential for a move back to the 17,000 level where the 50-day EMA is to be found.
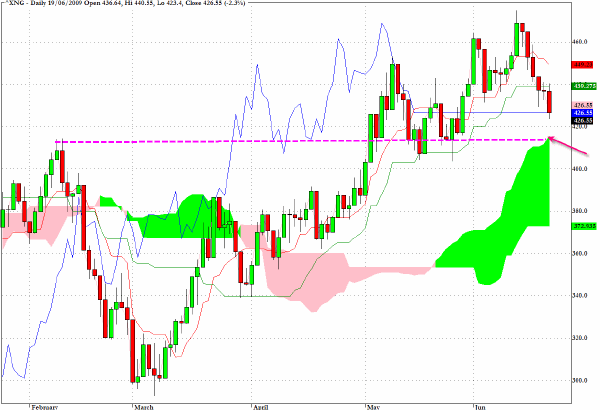
Using the Ichimoku charting technique, the Natural Gas index (XNG) could find a support level for a bounce as it approaches the top of the green cloud and an area of previous chart resistance and support.
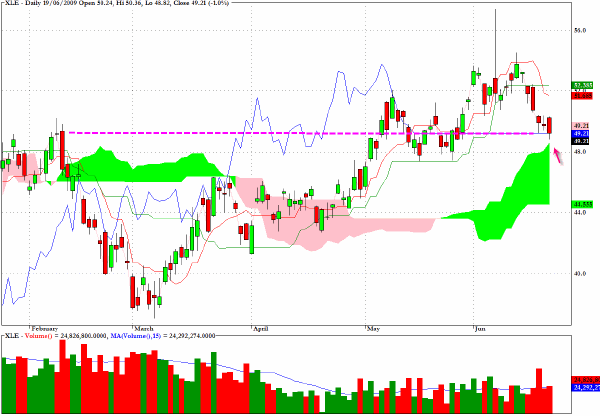
XLE, which tracks the energy sector, has returned to a possible area of chart support which coincides with the top of the green cloud on the Ichimomku chart below.
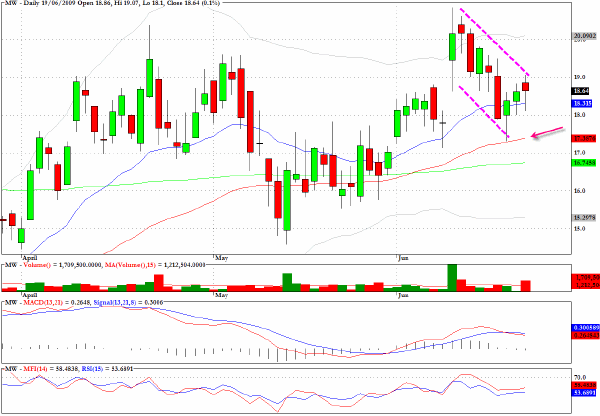
Men’s Warehouse (MW) has pulled back from the strong upward spike on heavy volume from nine sessions ago. This will be on my watch list this week for the long side.
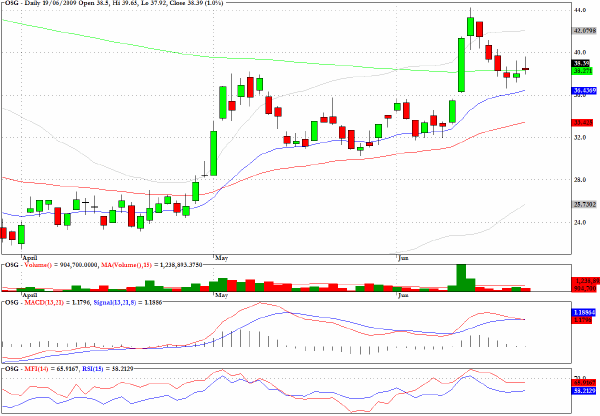
Overseas Shipholding Group (OSG) has a bull flag formation and the pullback could be close to completion.
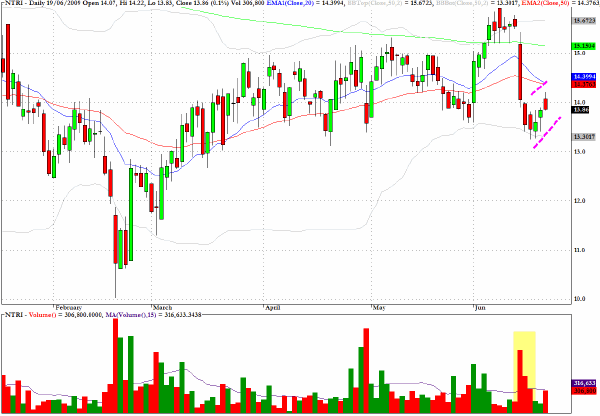
Nutrisystem (NTRI) has a bearish flag formation and another attempt to rally back towards the overhead moving averages could provide a good entry point on the short side.
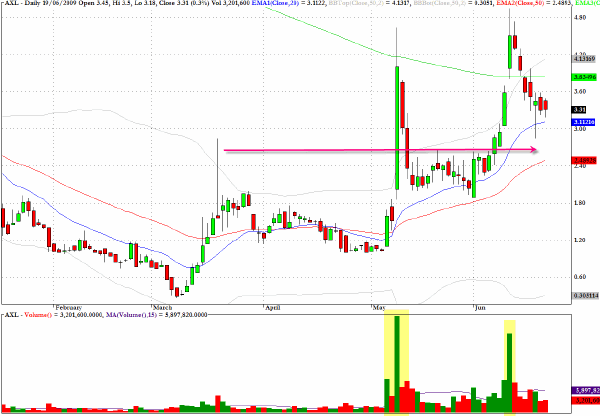
American Axle (AXL) has two adjacent pullback patterns following price surges. The first, which followed the very extended green candlestick on heavy volume in early May, extended for much of May but gave way to further accumulation and eventually produced the second strong price action in mid June.
A second pullback is now under way could lead to another show of support for the stock, and for intraday traders the focus should be on monitoring the 30 and 60-minute charts for evidence of a bull flag pattern which reflects the larger time frame formation.
Clive Corcoran is the publisher of TradeWithForm.com, which provides daily analysis and commentary on the US stock market.
|