| Corcoran Technical Trading Patterns For June 23 |
| By Clive Corcoran |
Published
06/23/2009
|
Stocks
|
Unrated
|
|
|
|
Corcoran Technical Trading Patterns For June 23
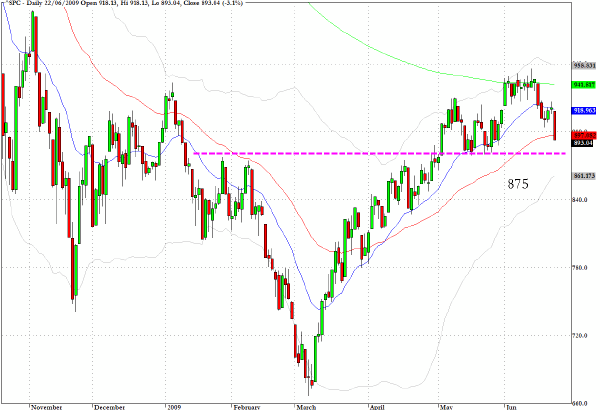
Yesterday’s comment that the S&P 500 "is looking less sure of itself than it has done for some time, and the possibility of a sudden drop is increasing" proved to be more timely than I perhaps realized. The wedge formation which I have also been propounding now looks to be firmly broken.
The major casualties in yesterday’s selloff were commodity-related stocks, industrials, shippers, transportation and some of the emerging markets. It raises again the questions that were being asked more than a year ago about the de-coupling thesis.
Although more and more analysts and investors are coming to the view that the US and other developed economies could be in for a hard slog with a recovery, when it does come, being anemic at best, the bulls have been inspired by the notion that the BRIC countries are sufficiently robust to make it without the dynamism of the more advanced economies. The thinking goes that they will be able to withstand the decline in the previously voracious appetite of US consumers by tapping into their domestic markets for alternative sources of consumer demand.
Without doubt, this debate will continue to rage on, but from time to time the over-enthusiasm of some traders in pushing commodities and the re-inflation trade into mini-bubbles will result in the kinds of collapses that some of the decoupling plays experienced yesterday (see below for some examples - FCX,CENX,MON, DD,EXM,etc.)
In general terms this underlines the potential for serious vacuums to be found below a lot of stocks that have benefitted recently from the high frequency rotation and arbitrage strategies being implemented by a lot of Wall Street firms and hedge funds. While these very sophisticated algorithmic strategies can provide the appearance that all is well and that the markets are recovering, if there is not a critical mass of fund managers and other vested interest constituents wanting to preserve the gains of the last three months, the algorithms are abruptly faced with evaporating liquidity except on iterating through a series of declining bids.
Questions are now being asked about how large this correction will turn out to be and whether it is now a relatively one way market downwards.
I would not be surprised to see the S&P 500 drop to a retest of the 875 level where support could be found from fund managers looking to put some beaten up stocks in their portfolios for the end of quarter. As I indicated yesterday my intuition is that July and August could prove rather troublesome for global equities in general and there is always the possibility that a government auction will bring forth a shock realization that Treasuries, gilts, bunds, etc. may find it increasingly hard to find proud new owners other than via their own central bank purchases.
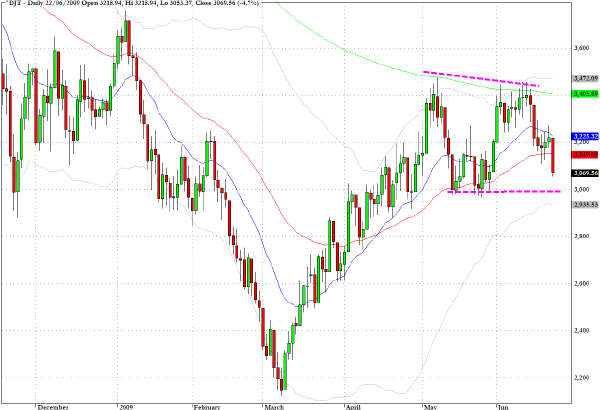
Reflecting the fact that the green shoots scenario is losing its luster, the biggest drop among the broad domestic indices for the US was seen in the Dow Jones Transportation Index (DJT) which dropped by 4.7 percent in yesterday’s sell-off.
Reviewing the chart for May and June, the declining trendline through the highs and the inability of this index to reach back to its January high was a technical divergence that added weight to the view that the market had been drifting sideways more in hope than founded upon a more realistic economic outlook.
The Transports look set to test the 3000 level (as annotated on the chart) and could easily be looking at having to retest support at several layers beneath that.
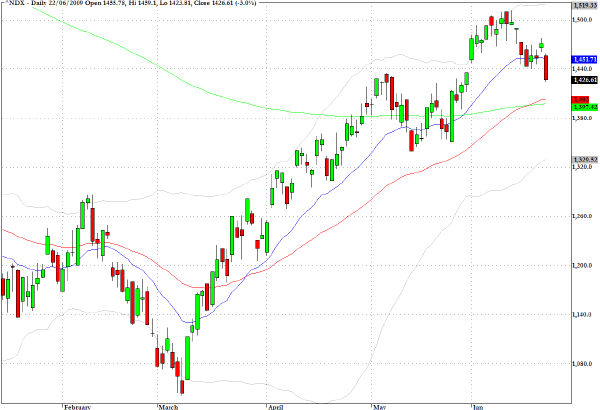
The Nasdaq 100 index (NDX) has been the relative out-performer during recent weeks and even after yesterday’s sharp decline the index remains above both its 50 and 200-day EMA’s.
The crossover recently which brought the 50-day moving average above the 200-day moving average was considered a significant technical achievement.
The 1400 level on the index should offer firm support in the next few sessions. Longer-term it would be another technical warning if the moving averages were to crossover in the opposite direction.
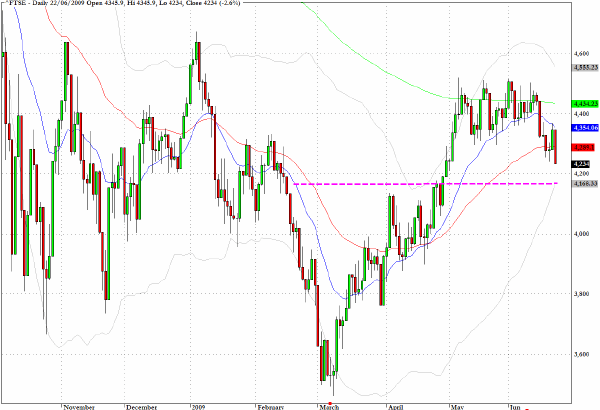
The FTSE index in the UK could be headed towards a re-test of the 4170 level in coming sessions.
Over the last week I have featured a number of commodity-related and industrial stocks that seemed to be vulnerable to the correction which is now under way.
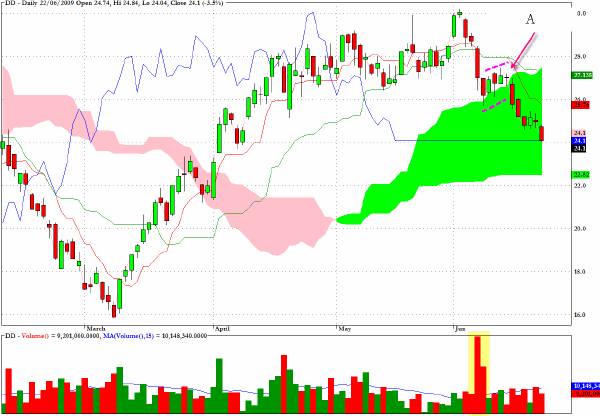
Last week I suggested that Dupont (DD) was revealing a bearish flag formation and I have indicated by an arrow where one could have instigated a short sale in the following session.
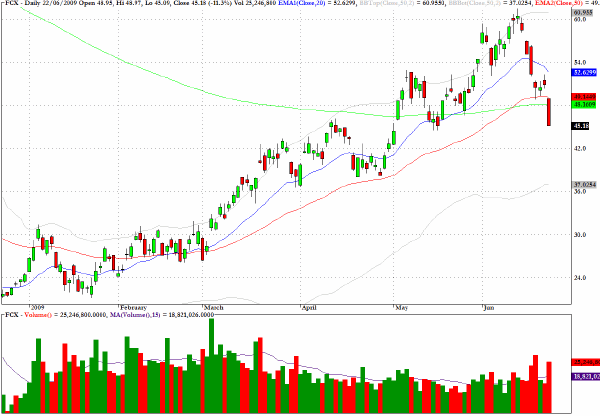
As a reminder of another warning about the nature of the runup in commodity-related stocks, there was this warning about Freeport McMorran (FCX) in another recent commentary.
The $60-65 region, which marks yesterday’s close, coincides with some potential resistance from previous support resistance levels and the 200-week EMA. There may be further gains ahead but the risk/reward ratio is becoming less attractive for this play.
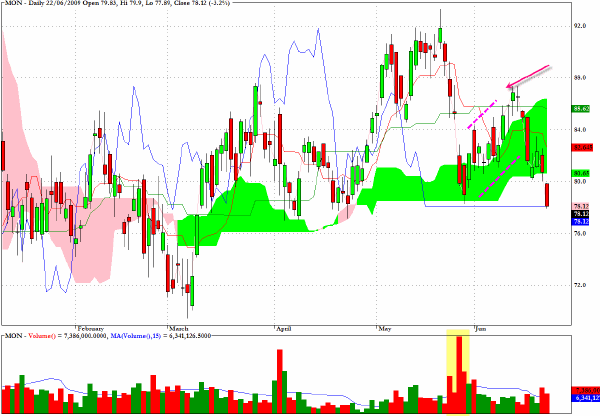
In a similar vein I noted last week that Monsanto (MON) appeared vulnerable to renewed weakness near current levels.
After yesterday’s selloff the stock has broken below the green cloud on the Ichimoku chart and within the orthodox interpretation of this charting technique this would validate the notion that this stock is now within a new bearish phase. Indeed it would be rather remarkable if this stock was not to retest the March low.
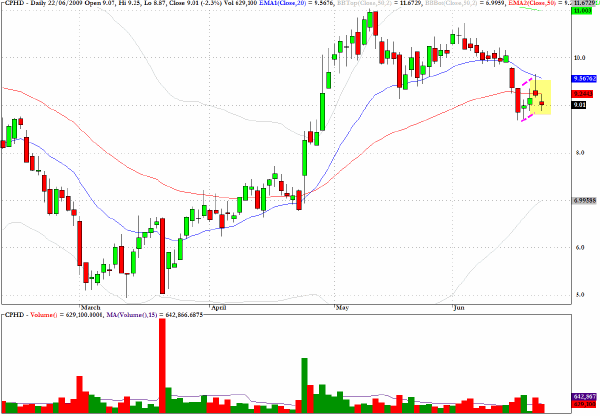
Cepheid (CPHD) managed to avoid a big plunge in yesterday’s session but the technical pattern for the stock seems patently weak.
Clive Corcoran is the publisher of TradeWithForm.com, which provides daily analysis and commentary on the US stock market.
|