| Corcoran Technical Trading Patterns For June 24 |
| By Clive Corcoran |
Published
06/23/2009
|
Stocks
|
Unrated
|
|
|
|
Corcoran Technical Trading Patterns For June 24
The markets will be in a holding pattern again today as they await the FOMC statement and secondarily the results of the Treasury auction.
Despite Monday’s broad-based sell-off, there was little in the way of a relief rally from equities in yesterday’s session as traders sit on the sidelines waiting to unravel what the Fed’s thinking is in relation to further quantitative easing and even the slight possibility of a hint that short term rates will need to be nudged higher later in the year. Few expect there to be a focus on the need for any tightening of monetary policy but the FX market and those guaging the appetite of global central banks for Treasury paper may have other thoughts on the matter.
The FOMC is in a box, as I have alluded to many times in recent months, and to express matters as simply as possible - If the statement from the FOMC sounds too tough on the need to keep short-term rates under review so as to alleviate poor Treasury auction anxieties, stocks will slump; if it doesn’t sound as though the Fed is at least thinking about an exit strategy from QE, bonds and the dollar may well slump.
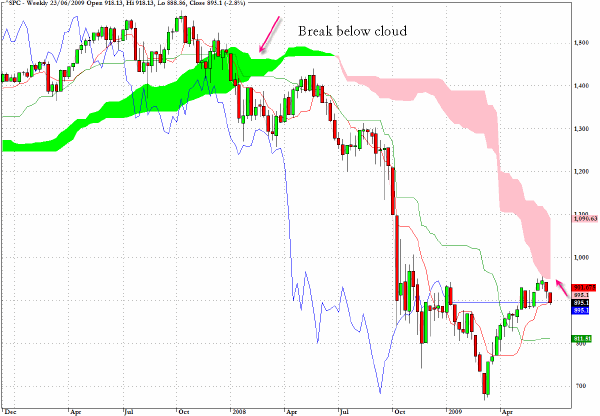
The weekly Ichimoku chart for the S&P 500 rather intriguingly reveals that the three-month rally in the index stalled almost exactly at the entry point to the pink cloud.

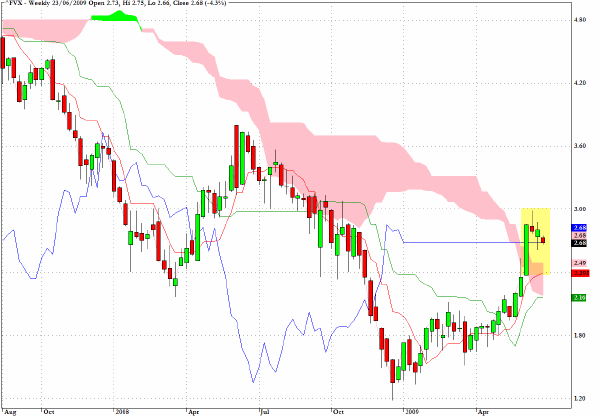
The longer-term application of the Ichimoku charting technique to yields on Treasuries also provides some interesting perspective on the chart which tracks the yield on five-year notes. For the first time since the late summer of 2003, the yield on this pivotal part of the yield curve is moving above the pink cloud suggesting that further increases are to be expected.

The other key piece of the puzzle for today’s trading will be the FX market where the dollar appears to be coming under increasing pressure, adding another dimension of concern to the difficulties facing Chairman Bernanke.
The euro was energized by comments yesterday from European Central Bank council member Axel Weber who claimed that the bank has used up its room to cut interest rates and there’s no need to expand its stimulus measures. The thinking goes that this may inhibit further tentative steps into quantitative easing by the ECB and is giving a boost to the euro.
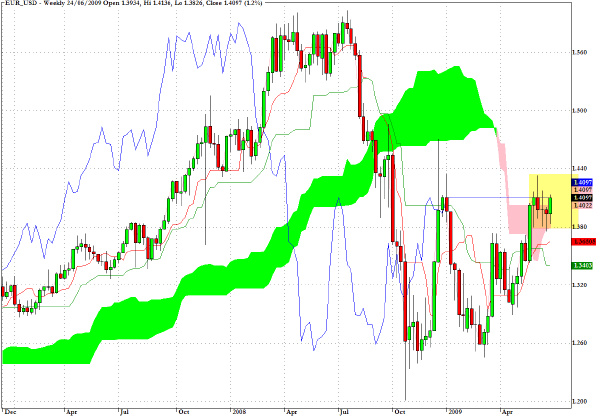
Once again the weekly Ichimoku chart reveals a bullish bias for the currency, although from other indicators I would be inclined to believe that the closing high of $1.44 seen in North American trading on December 17, 2008 will be quite a key resistance level.

Clive Corcoran is the publisher of TradeWithForm.com, which provides daily analysis and commentary on the US stock market.
|