| Corcoran Technical Trading Patterns For June 25 |
| By Clive Corcoran |
Published
06/25/2009
|
Stocks
|
Unrated
|
|
|
|
Corcoran Technical Trading Patterns For June 25
Several readers have expressed a desire to know more about Ichimoku charts and are intrigued, in particular, by the manner in which prices observed at the outlines to the cloud formations coincide with pivotal and strategic price levels discernible from other forms of technical analysis.
The more I have been working with this charting technique the more comfortable I am becoming with some of its idiosyncrasies, and while there are still many aspects to the technique that I will want to explore with readers, I think the elegance and power is already becoming evident.
Yesterday’s action saw a rather erratic response to the FOMC statement which may have more implications for the bond market than for stocks in coming sessions.
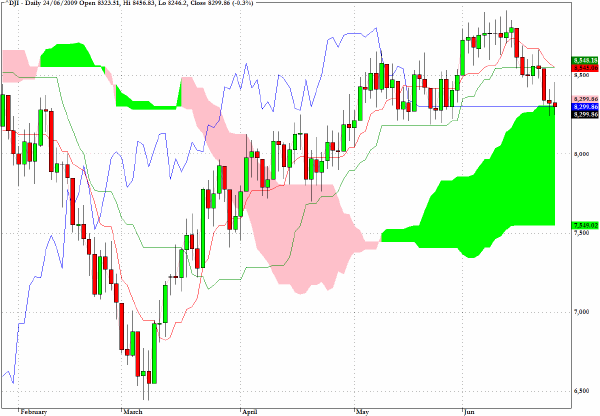
The Dow Jones Industrials (DJI) was unable to finish with a positive close and came to rest at exactly the top of the green cloud in the chart below.
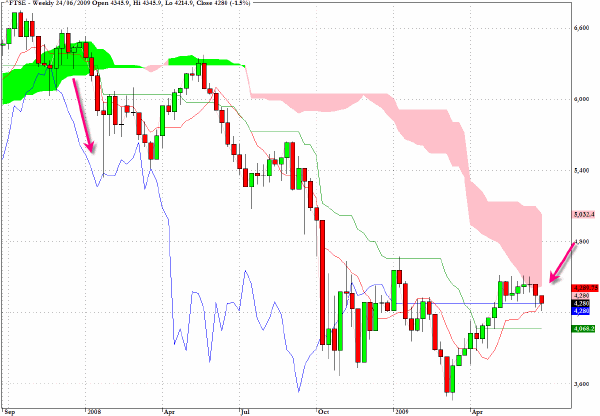
Earlier this week I discussed the FTSE which had attained the 4280 level last Thursday, and once again the index closed yesterday’s session at exactly this level.
The weekly Ichimoku chart below reveals how this is a critical level and illustrates the usefulness of the longer time frame applications of the charting technique.
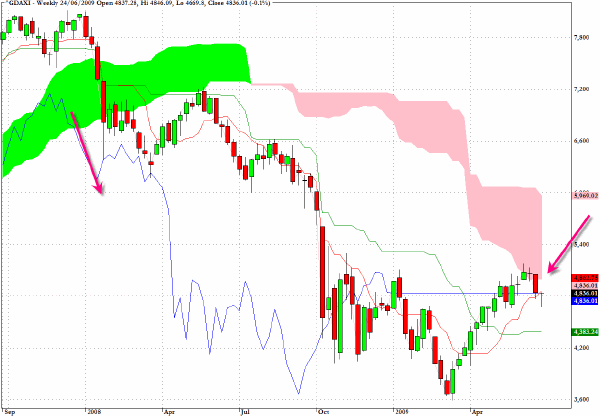
The DAX in Germany has dropped back by more than 1.5% in Thursday trading as I am putting this column together. One could apply an interpretation similar to that of the UK’s FTSE to the weekly Ichimoku chart for the German index.
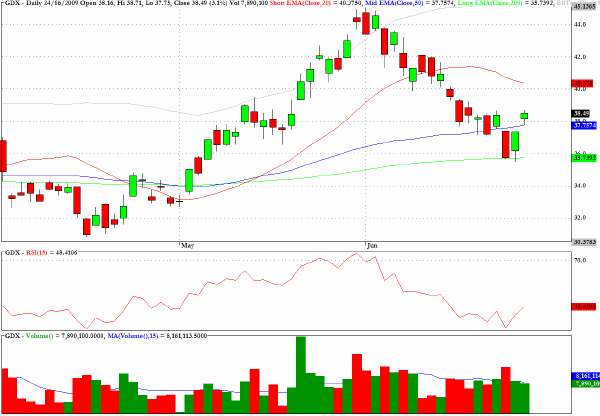
GDX, which provides exposure to the gold mining stocks via an exchange traded fund, rallied from a key level and could make further progress - but for now this is an opportunistic trade in my opinion.
I am still of the view that the long-term prospects for gold and the mining stocks especially, have the potential to stage a sharp rally but the fear level has to rise a little more for the background conditions to be supportive.
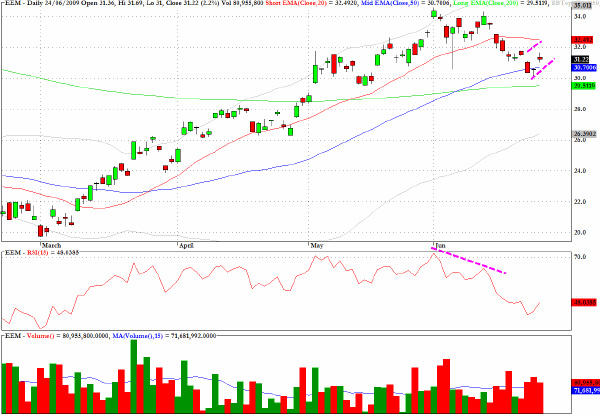
EEM, the sector fund which tracks the MSCI Emerging Markets Index, could be in the process of forming a bearish flag which could take us through the quarter end.
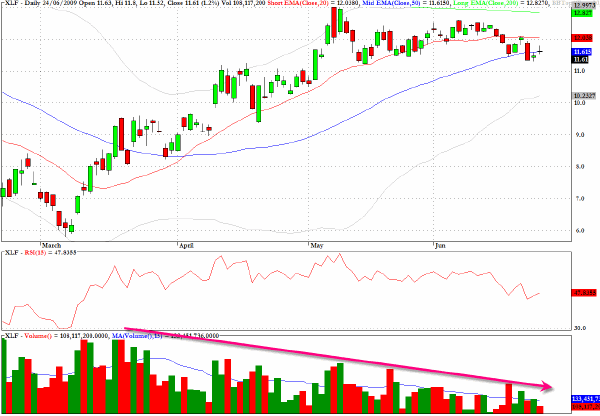
XLF, one of several exchange traded funds which track the financial services sector, has drifted sideways since mid-May on declining volume, which is hardly supportive of the thesis that accumulation is taking place.
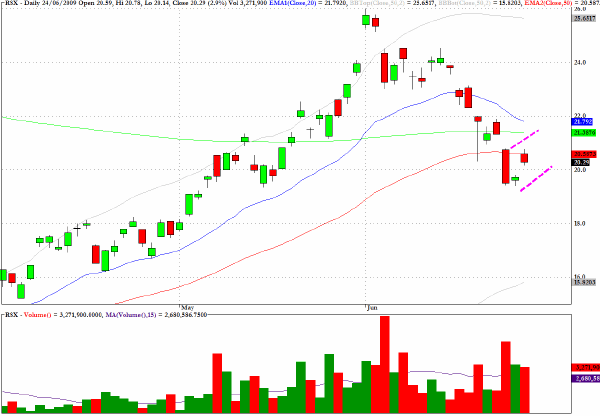
RSX, a geographical sector fund which allows exposure to primary Russian equities, is also revealing evidence of an emerging bear flag.
Clive Corcoran is the publisher of TradeWithForm.com, which provides daily analysis and commentary on the US stock market.
|