|
The Wagner Daily ETF Report For June 26
Following through on the previous day's bounce off the recent lows, the main stock market indexes scored a solid round of gains yesterday. Stocks initially opened lower, but the bulls quickly took control, reversing the broad market into positive territory within the first thirty minutes of trading. The morning strength persisted, enabling the major indices to build on their gains as the day progressed. The S&P 500, Nasdaq Composite, and Dow Jones Industrial Average all scored identical gains of 2.1%. Small and mid-caps performed even better. The Russell 2000 advanced 2.9% and the S&P Midcap Index climbed 2.5%. Each of the major indices closed near its intraday high.
Total volume in the NYSE increased 7%, while volume in the Nasdaq edged 3% higher than the previous day's level. The gains on higher volume enabled the S&P and Nasdaq to register a bullish "accumulation day," though trading in both exchanges remained lighter than average. Market internals were firmly bullish. In both the NYSE and Nasdaq, advancing volume exceeded declining volume by more than 7 to 1.
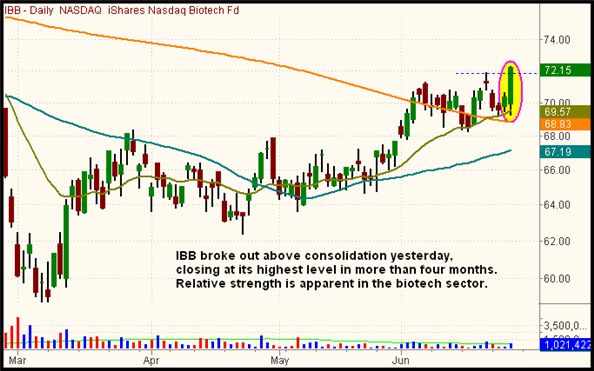
The iShares Nasdaq Biotech (IBB), which we've been long since June 8, broke out of a multi-week base of consolidation. Jumping 2.6% yesterday, IBB closed at its highest level since mid-February of this year. Because the major indices are presently in a short-term correction, significantly off their highs from earlier this month, IBB is now exhibiting clear relative strength by breaking out ahead of the broad market. Bullish momentum from yesterday's breakout should now enable IBB to rally to the next resistance level of its February 2009 highs in the short-term. The breakout is shown on the daily chart of IBB below:

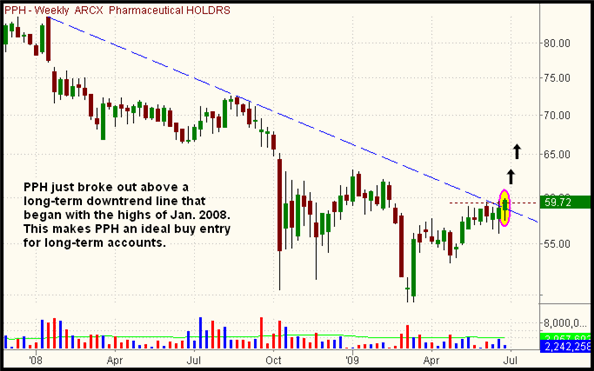
Along with IBB, other healthcare-related ETFs are now exhibiting relative strength and bullish chart patterns as well. The Pharmaceutical HOLDR (PPH), comprised of a small portfolio of the largest pharmaceutical companies, just broke out of a long-term downtrend that has been in place for nearly a year and a half. This is shown on the weekly chart of PPH below:

As institutional funds continue rotating into the healthcare arena, look for both IBB and PPH to continue higher in the short to intermediate-term. Further, when ETFs break out above clearly-defined, long-term downtrend lines, as PPH has just done, they present ideal buying opportunities for less active investors and traders. If buying an ETF immediately after it reverses the direction of its dominant trend, an initial protective stop can be placed right below the breakout level. Then, as the new uptrend develops, the stop can be trailed below support of the ascending uptrend line. The simple concept of catching ETFs reversing their long-term trends, that show relative strength as well, is the main strategy of the positions in our ETF Portfolio Tracker service.
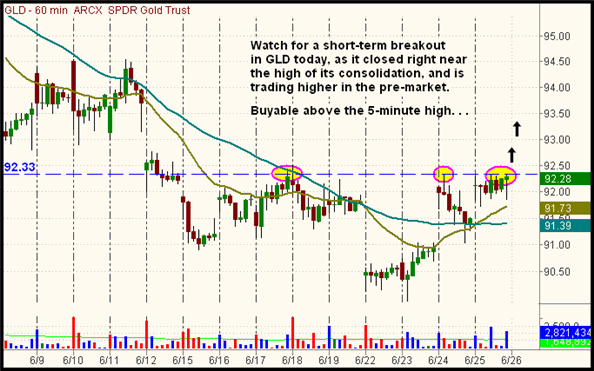
In yesterday's commentary, we looked at the chart of SPDR Gold Trust (GLD), which was poised to break out above its short-term downtrend line and resume its long-term uptrend. Specifically, we said, "So far, it's looking as though the weakness on June 22 and 23 may have been a classic "shakeout," designed to cause traders and investors with tight protective stops to close their positions at the lows of the range. Looking at the historical price action of these two ETFs (GLD and SLV), one will quickly notice such "shakeouts" are relatively common. . .If GLD manages to close above yesterday's high, in today's session, it could quickly zoom back to its recent highs." GLD went on to gain approximately 1% yesterday, and closed just 2 cents shy of the previous day's high. On the short-term hourly chart below, GLD's potential short-term breakout above consolidation is readily apparent:

Presently, spot gold futures are trading higher in today's pre-market session, which means GLD is poised to gap higher when the market opens. As such, GLD should present an ideal buying opportunity for traders who've been looking for an entry. With gap ups, we like to wait to buy above the high of the first five minutes of trading. Waiting for the ETF to rally above the opening five-minute high helps minimize the chance of getting sucked into a false breakout. Since we already have silver exposure (with SLV), we'll pass on "officially" buying GLD today, but wanted to give a heads-up to traders who may be interested.
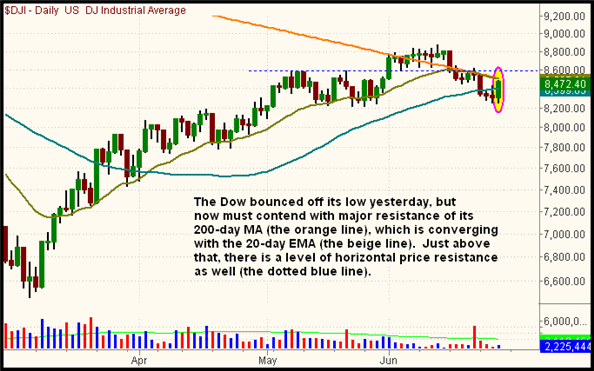
So far, yesterday's strength in the broad market can be regarded as nothing more than a bounce from short-term "oversold" conditions. The S&P 500 only retraced about half of its range from the June high down to June low, while the laggard Dow has only recovered about one-third of its retracement off the June high. Furthermore, the Dow now must contend with major resistance of its 200-day moving average, which happens to converge with resistance of the 20-day exponential moving average as well:

If playing the long side of the market on this bounce, stay alert and keep your finger on the sell trigger. There's quite an abundance of overhead supply, left behind in the wake of the recent correction. Uptrend lines have also been broken, so the technical damage of breaking those trendlines will now act as resistance on any subsequent strength.
Open ETF positions:
Long - IBB, UNG, SLV, DBA, SKF
Short - (none, but SKF is an inversely correlated ETF)
Deron Wagner is the Founder and Head Trader of both Morpheus Capital LP, a U.S. hedge fund, and MorpheusTrading.com, a trader education firm.
|