| The Wagner Daily ETF Report For July 2 |
| By Deron Wagner |
Published
07/2/2009
|
Stocks
|
Unrated
|
|
|
|
The Wagner Daily ETF Report For July 2
Stocks opened up the new month in impressive fashion, as broad market indices raced more than 1% higher in the first hour of trading. The strong start was broad based and backed by healthy internals, so as the market consolidated over the next few hours in a tight range, the odds of an afternoon follow through to the upside were looking good. But as the major averages pulled back through the early afternoon there were no buyers to be found. Stocks sold off steadily the rest of the day and completely retraced the morning gains by the close. The Nasdaq Composite, S&P 500, and Dow Jones Industrial Average all closed near the lows of the session, up 0.6%, 0.4%, and 0.7% respectively. The S&P Midcap 400 gained 1.1%. The small-cap Russell 2000 held up best, finishing up 1.8%.
Turnover came in lighter on both exchanges. NYSE volume finished 23% off Wednesday's pace, while Nasdaq volume decreased by 4%. Total volume in the Nasdaq had been tracking 5% higher most of the day until the final thirty minutes of trading, when volume dropped from +5% to -4%. The lighter volume prevented the Nasdaq from churning at the highs, which occurs when the price action probes above a prior day's high, but fails to follow through and closes lower on heavier volume. The fact that the selling did not increase during the afternoon as the broad market sold off is a positive for the bulls.
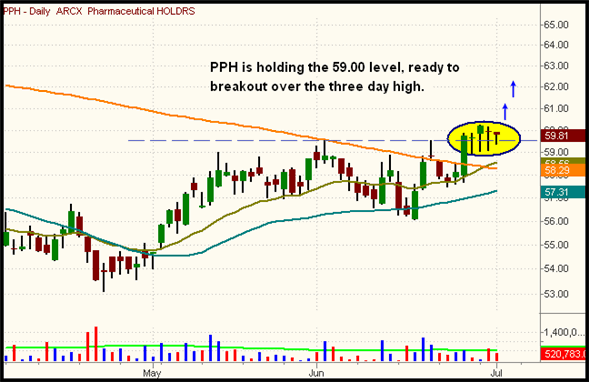
The healthcare sector continues to show the most promise on the long side right now. Pharmaceutical HOLDRS (PPH) has formed a tight trading range on top of the prior base highs. A breakout above the three-day high on a pick up in volume is a buy signal on the chart below.
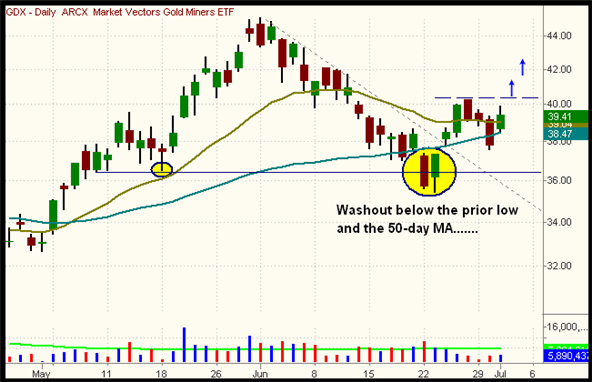
Market Vectors Gold Miners ETF (GDX) is an interesting long setup after a bullish reversal back above the 50-day MA last week. Note how the last selloff washed out all the longs beneath the prior low and the 50-day MA. Look for a buy entry on a close above the 40.00 level.
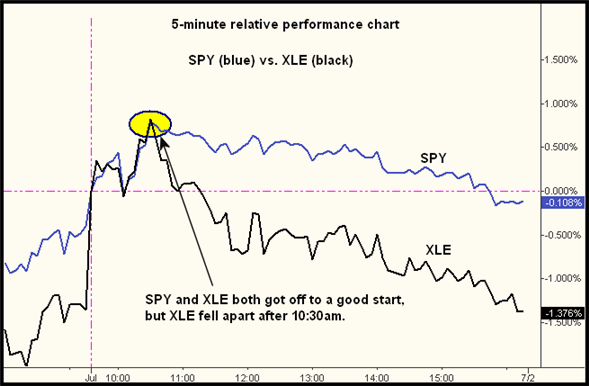
Commodity based ETF's have struggled to bounce higher after selling off sharply last month and may be ready for another leg down. MOO, OIH, XLE, IEO, SLX, and KOL have formed "bear flag" type setups over the past two weeks. Below is a 5-minute intraday chart, detailing the relative weakness in the energy sector (XLE) vs. the S&P 500 (SPY) yesterday.
The daily chart of XLE below details the bearish reversal action:
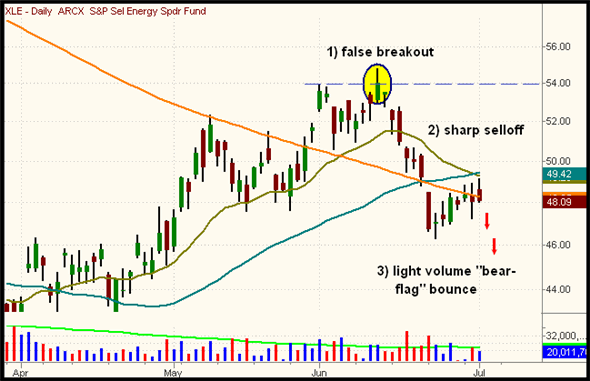
The false breakout at the highs (1) around 54.00, is followed by a sharp selloff in mid-June (2). The weak bouncing action on light volume formed a "bear flag" setup (3). Look for a breakdown below 48.00 to begin the next leg down. A test of the April lows around the 43.00 - 44.00 area is the target.
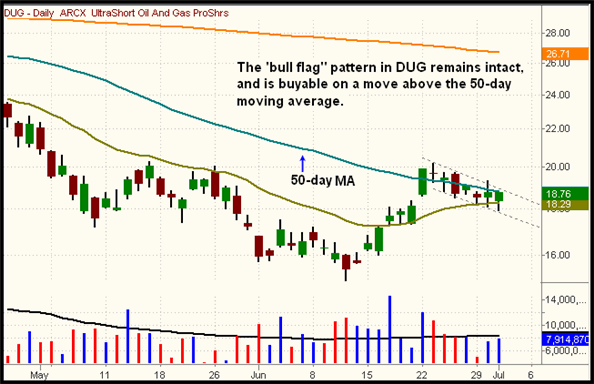
To profit from the relative weakness in the energy sector, we established a long entry in the UltraShort Oil and Gas ProShares ETF (DUG) on 6/30. The "bull flag" pattern still looks good, as yesterday's shakeout below the 6/30 low closed back above the 20-day EMA. A move above yesterday's high and the 50-day MA is a low-risk entry point for those who are not already long.
Open ETF positions:
Long - IBB, SKF, DUG, DXD, UNG
Short -
Deron Wagner is the Founder and Head Trader of both Morpheus Capital LP, a U.S. hedge fund, and MorpheusTrading.com, a trader education firm.
|