With all the volatility we've been through over the last two weeks, it's difficult to distinguish which stocks are bearish, and which ones were just victims of a weak market. But, we are seeing some suspicious breakdowns in the cyclical stocks that suggest these companies' best days are behind them. Both the Morgan Stanley Cyclical Index (CYC) and the Dow Jones Cyclical Index (DJUSCG) have fallen under some key support levels, and look poised to sink even lower.
As for the 'why', just think about what a cyclical is. As the name implies, these are stocks that respond according to which phase of the economic cycle we're in. It's never really clear which phase is upon us until it's over, but now being three years into the economic recovery, we're closer to the end of the cycle than the beginning. Some refer to this as the peak, or the plateau, although that name may be a bit misleading - the economy as well as most stocks can continue to go grow, even after an economic peak. Nevertheless, after a couple of years worth of rate hikes and a verified slowing in the Gross Domestic Product growth rate, things are starting to cool off.
The likely victims of such a cooling are the cyclicals, which include names like Ford, Motorola, Caterpillar, Dow Chemical, U.S. Steel, and others. The one common element among all of these companies is that their products and services are in high demand when economies are growing. However, when an economy is stagnant, and very few individuals or corporations are interested in buying new equipment or making new capital purchases, these stocks can reflect that softening in demand. Hence the name, 'cyclical'......and that's why we're not optimistic (in general) about the sector going forward. The charts already indicate some of this weakness. Let's take a look.
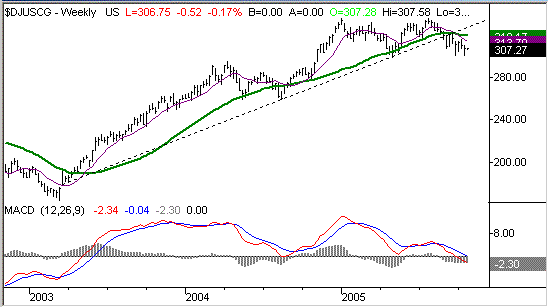
The Dow Jones Cyclical Index (DJUSCG) fell under its 200 day average (green) in late August. It had been a little under it a couple of times over the last two years, but the current reading of 307.27 is well under the 200 day line. So, there's a blatant lack of buying interest here. But the technical breakdown really occurred with the fall under the long-term support line (dashed). This line extends all the way back to bullish gap made in March of 2003. From here, a close under April's low of 299 would clinch the deal, but there's enough bearish evidence here to go ahead and make the call. We'll set a target at 272, with a stop on the bearish bias at the 50 day average, which is at 314 for now.
Dow Jones Cyclical Index (DJUSCG) - Weekly

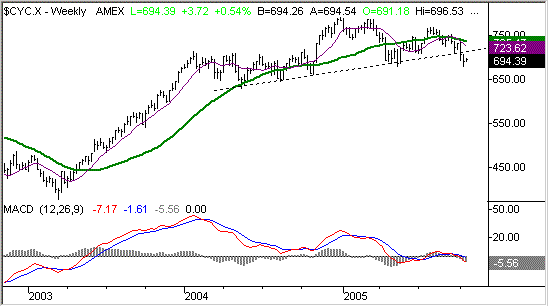
The Morgan Stanley Cyclical Index (CYC) pretty much looks the same, although there are a few minor differences. The 200 day line here has been breached, as has the long-term support line. However, this long-term support doesn't extend back to early 2003. This one just goes back to lows from May of 2004. One could make an argument that the chart (since then) has made a complete bearish head-and-shoulders pattern. We wouldn't argue against that, but that's not the only criteria that's leading us to this conclusion. Like the Dow's chart, we'd prefer to see a close under 678 to get really bearish. That's where the Morgan Stanley index bottomed last week, as well as in May. But, that doesn't change the bearish challenges we still see here. Our target here is 610, with a closing stop of any close above the 50 day line. It's currently at 723, but dropping quickly.
Morgan Stanley Cyclical Index (CYC) - Weekly

The only caveat here is to recognize that there are exceptions. While all stocks could potentially be classified in more than one sector, for the cyclicals, that potential is enormous. For instance, Dow Chemical could also be a basic material stock, and Motorola could be a technology stock. Just keep in mind that our take on these charts is for cyclicals in the aggregate. Your individual stocks may not behave like the typical cyclical name.
Price Headley is the founder and chief analyst of BigTrends.com.