The hammer pattern seen on chart for the Dow Jones Industrials, also evident on the S&P 500 chart and the Russell 2000, could be interpreted as a short-term bullish indicator for Tuesday’s session.
Asian markets have slipped again in trading on Tuesday and European markets appear to be waiting for further clues from the US later today following yesterday’s rather mixed session, which saw some buying emerge as traders tested key levels on the S&P 500, but which also saw continuing weakness on small cap, high beta stocks, as well as some big drops in commodity-related and industrial stocks.
The bleak employment data released last Thursday will continue to hover over the "green shoots" bandwagon and the action in commodities is suggesting that a lot of hot money is now exiting the reflation trade.
The Ichimoku chart for the Dow Jones Industrials below once again displays the usefulness of monitoring the top of the green cloud formation on the right hand of the chart as a support level.
The long lower tail seen on yesterday’s candlestick, a hammer pattern, also evident on the S&P 500 chart and the Russell 2000 (see below), could be interpreted as a short-term bullish indicator for Tuesday’s session.
However, the action yesterday in the market, from my perspective at least, lacked a sense of conviction that the market was robustly tested at the key levels which were touched. The onus is now on the bulls to provide the necessary buying support as the markets fret over the notion that the horizon signaling an end to the recession is slipping further away. 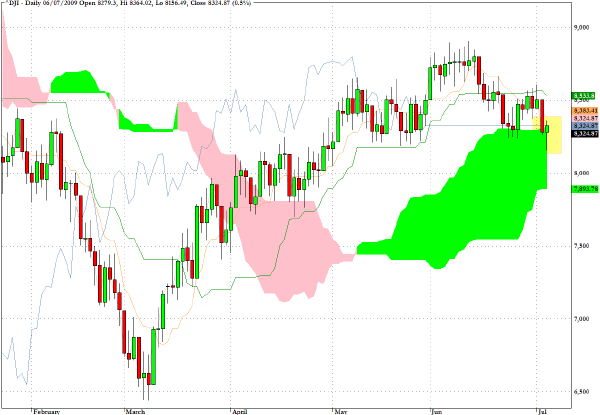
The CBOE Volatility Index (VIX) registered a red candlestick indicating that the rally in equities towards the close of yesterday’s session produced some short covering for those who are placing bets that we are heading into a more turbulent period for equities again.
As discussed recently, the seasonal tendency is not supportive of further declines in this index, and although the behavior could be one which drifts for a while longer, the intermediate term suggests that a break above the clear descending trendline through fear spikes since March could be about to give way.
From an inverse perspective a break through the pink cloud for the VIX would be good for those long volatility but not such a rosy scenario for those long equities. 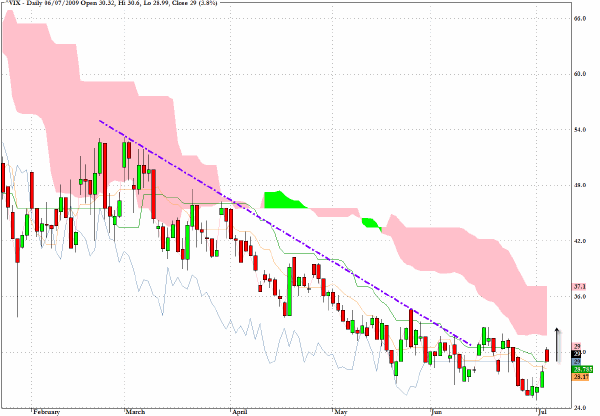
The Russell 2000 (RUT) left a long lower tail yesterday but still failed to close above its opening price. Traders have been playing the high beta stocks during the recovery phase from the oversold conditions of March, but the bad news for high beta stocks is that just as they deliver higher returns than the benchmark on the way up they also deliver subpar returns on the way down.
The lower Bollinger band level around 470 would seem to be a key level for retesting in the medium term. 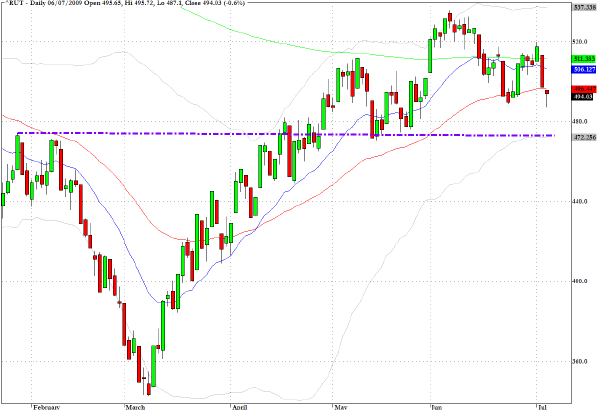
Commodities slumped across the board yesterday and the Rogers Commodity Index (RCT) gapped down noticeably from the potential support level of the 50-day EMA and, in so doing, fell out of a triangular formation which had been developing over the last two months.
As noted in the chart for the Russell 2000, the lower Bollinger band level around 18.90 also coincides with an extended support line from the March low, and I would expect this to be touched in the near term. 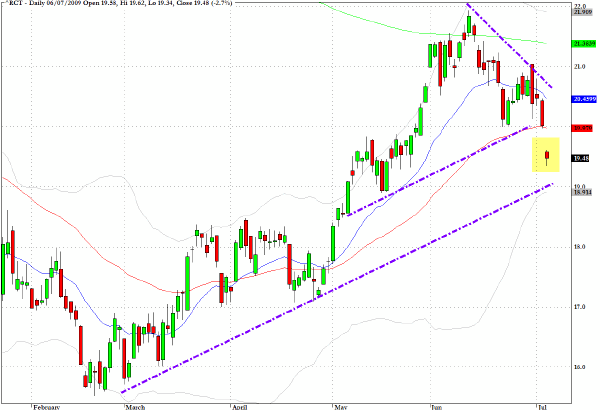
The Oil services sector fund, OIH, is nearing a key chart support/resistance level as well as a potential bounce off the bottom of the green cloud. In addition the RSI readings are approaching an oversold condition. 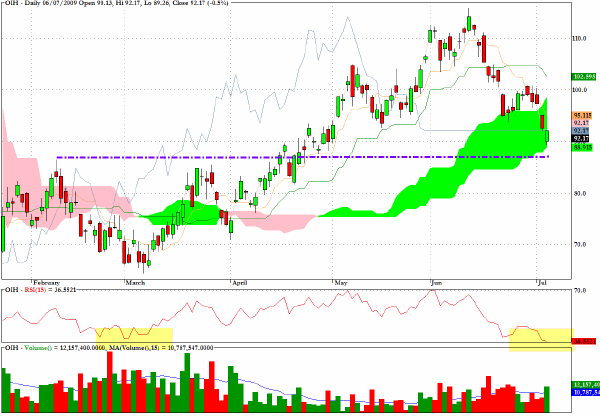
XME, an ETF which tracks the metals and mining sector, reveals the damage that was done to the mining stocks yesterday with the usual suspects, FCX, AA, CENX all registering significant drops.
I have marked the chart with the bear flag channel and as is common with breakdowns following such formations, the volume is now accelerating on the downside. As the RSI value heads towards the 30 level, a bounce should be forthcoming but the technical patterns suggest that a revisit to the $30 area seems probable in coming sessions. 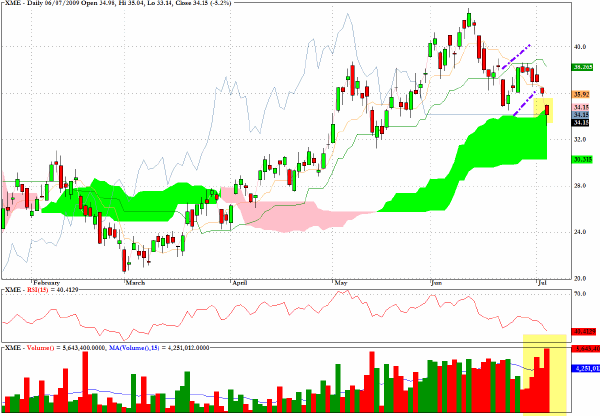
KBE, the exchange traded fund the KBW Banking Index, continues to reveal the almost horizontal formation which I commented on in my last newsletter before my break. The narrowing of the green cloud is a reflection of this price congestion pattern and the indication is that this sector is in a holding pattern until the Q2 earnings releases are available.
It will be the quality and decomposition of the earnings that will be most useful as an indicator for the state of the financial economy. Unfortunately, so much of the really key metrics will be obscured by the FASB changes which make bank’s balance sheets more opaque than they should be.
This sector, as always, will likely be a leading indicator as to the direction of the overall market as a lot of investors are still not prepared to believe that the banks are a compelling buy at current levels. 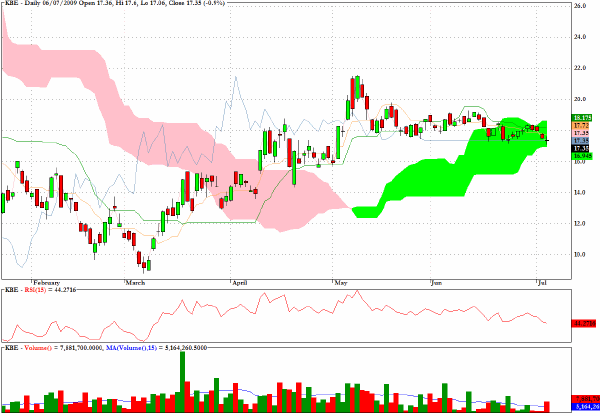
SLX, a fund which tracks the steel sector, fell to the top of its green cloud yesterday and the volume was almost three times the 15-day average. RSI readings are also reaching down towards similar levels seen in March, so playing the short side would only be recommended for intraday traders. 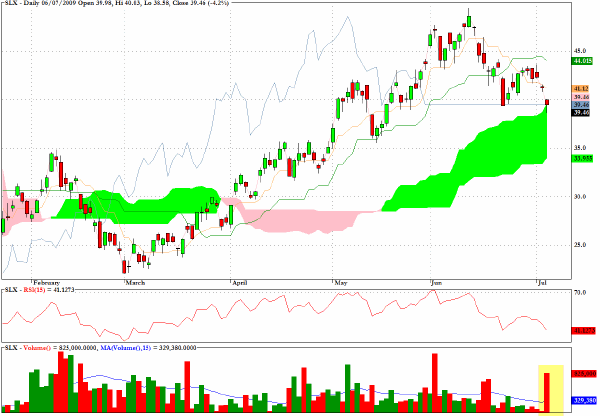
Clive Corcoran is the publisher of TradeWithForm.com, which provides daily analysis and commentary on the US stock market.