| Corcoran Technical Trading Patterns For July 8 |
| By Clive Corcoran |
Published
07/8/2009
|
Stocks
|
Unrated
|
|
|
|
Corcoran Technical Trading Patterns For July 8
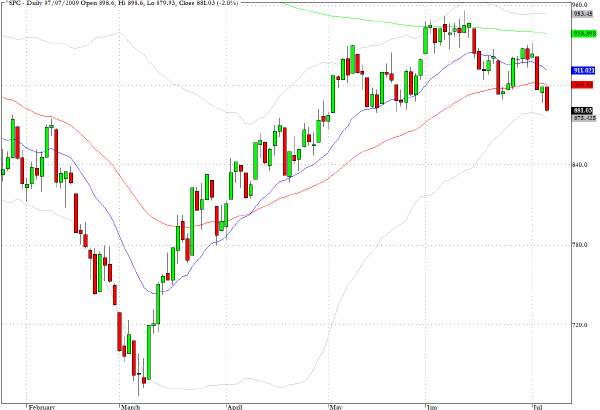
The S&P 500 resumed its downward trajectory yesterday and easily took out Monday’s low. As intimated here yesterday, the widely discussed test of the June 23 low and the rally which ensued in Monday’s session lacked the conviction that one would hope for from an alleged successful "test" of a key level.
The index closed at 881.03 and is now at its lowest level since May 21.
The overall volume levels in yesterday’s sell-off were not substantial and the volume on SPY was more or less in line with its average over the last 15 sessions.
Recent market action highlights the unreliability of certain, much celebrated, technical crossovers. A week ago, many were celebrating the golden cross when the 50-day SMA moved above the 200-day SMA.
As can be seen on the chart, the exponential moving averages did not come close to performing this cross and this is yet another reason why I do not advocate paying too much attention to simple moving averages.
The G8 leaders (except the Chinese premier who has returned to China in the face of growing civil disturbances in the western part of the country) are assembling in Italy to pose in front of the world’s media and provide evidence that they are "running" the world economy. This should not impress too many on Wall Street, but there is always the possibility of a surprise that could spook the currency markets.
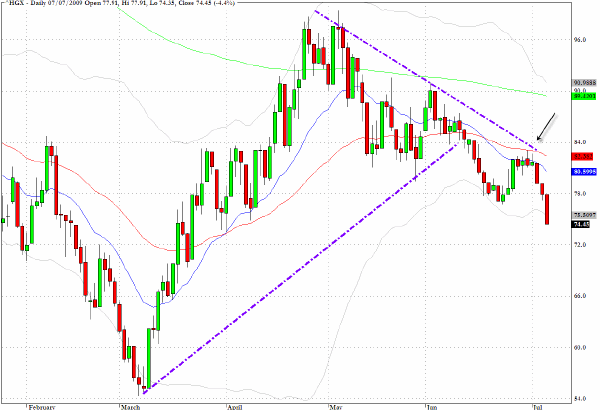
Not too long ago I was pointing to the very weak technical condition of the Philadelphia Housing Index (HGX), and the chart below reveals how the break down from the triangular pattern was followed by a failure at the critical level indicated by the arrow on the chart.
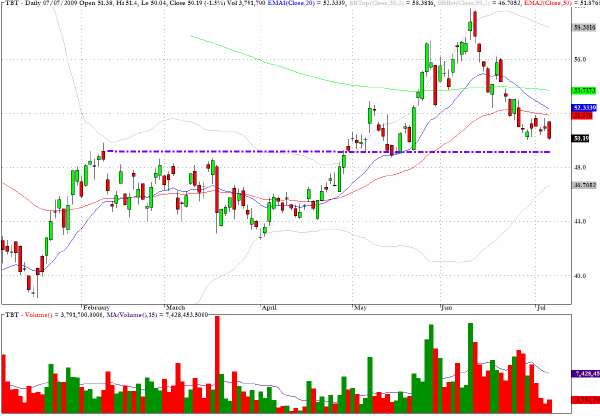
One beneficiary of the growing risk aversion and the far more subdued view as to the imminence of a recovery has been the drop in yields on long-term Treasuries.
Not only is there much less bounce in the step of those who were claiming that we were on the verge of restoration of business as usual, but there seems, revealing the bipolar nature of sentiment at present, a return to talk about depressions rather than recessions. This could get more than a little overdone and the bond market may have discounted a lot of this talk already.
The ETF which inversely tracks yield on 20-year bonds, TBT, has retreated to a level where it is worthy of consideration again. The Treasury has auctions for both 10 and 30-year bonds scheduled for today and tomorrow respectively.
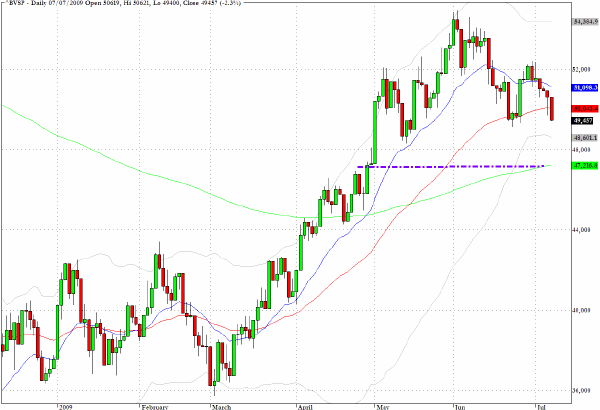
The Bovespa index in Brazil has fallen below its 50-day EMA and could well be headed to a test of its 200-day EMA as indicated in the chart below.
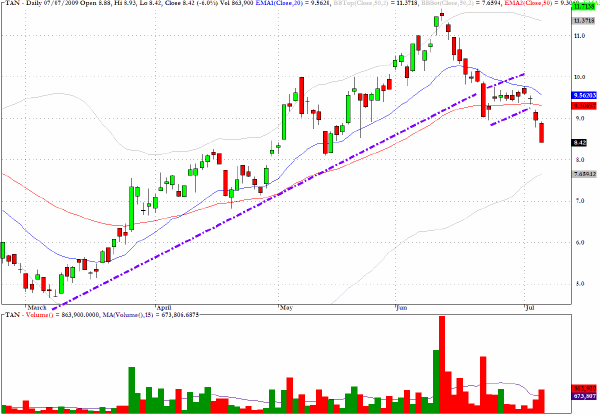
The last time that I discussed the solar energy sector fund, TAN, was in late June and I noted that negative momentum was in evidence and that the chart was suggesting that a correction was emerging.
The fund has fallen precipitously since the failure of the pullback channel (bear flag) at the critical level indicated on the chart.
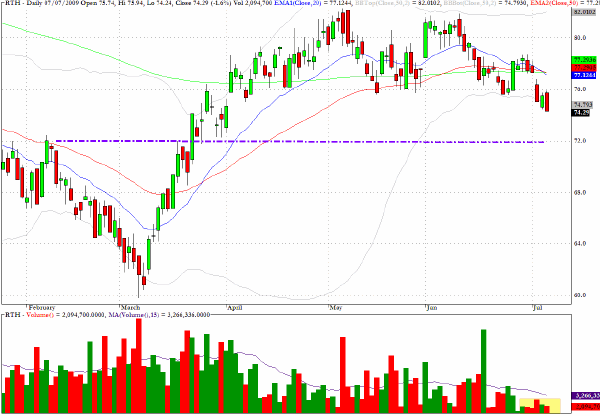
RTH, which tracks the retail sector, has continued to erode, but on light volume. The 72 level would seem to be a support level.
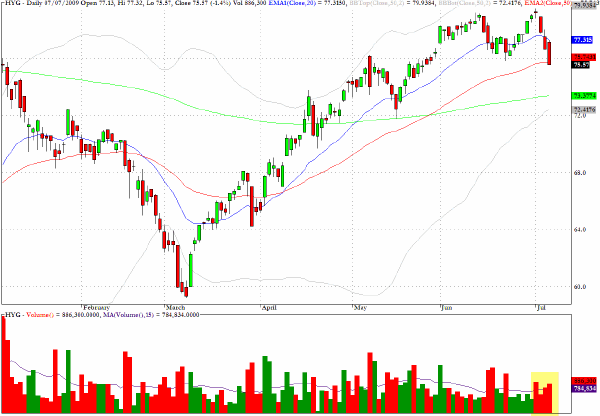
HYG, one of the ETF’s which tracks the high yield corporate bond market, has topped out and as the volume is picking up on the correction the proposed target would be the 200-day EMA level around $73.40.
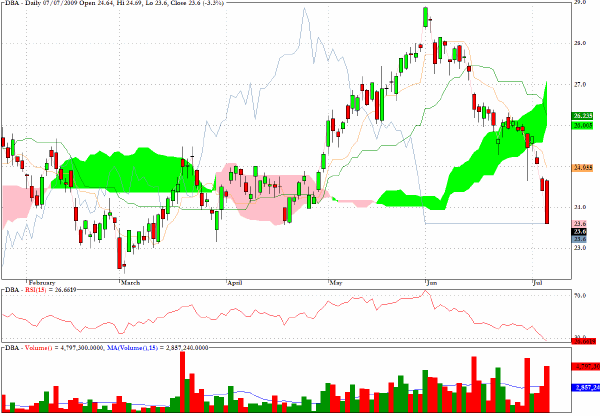
DBA, a sector fund which allows one to take a position on agricultural commodities, dropped by 3.3% on a substantial uptick in volume and would appear to be headed towards a revisit of the March low.
Evident on the chart is the acceleration in selling after the break below the green cloud at the end of June.
Clive Corcoran is the publisher of TradeWithForm.com, which provides daily analysis and commentary on the US stock market.
|