| Corcoran Technical Trading Patterns For July 10 |
| By Clive Corcoran |
Published
07/9/2009
|
Options
|
Unrated
|
|
|
|
Corcoran Technical Trading Patterns For July 10
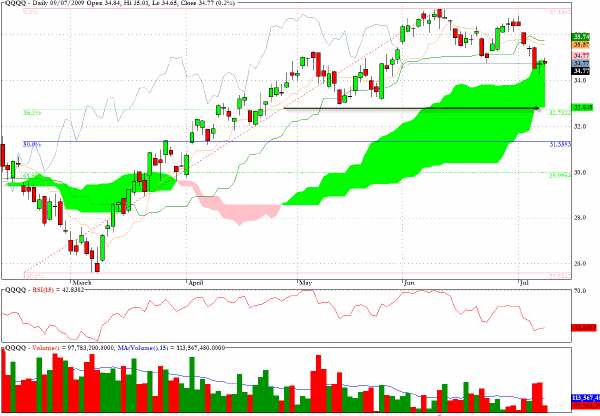
QQQQ has finally entered the green cloud on the Ichimoku chart. Intermediate term targets to be monitoring would be the following:
$32.75 area which would coincide with the 38% retracement of the key swing high/low seen on the chart
Same area at the base of the cloud
RSI chart needs to reach back towards 30 before a sustainable rally should be expected.
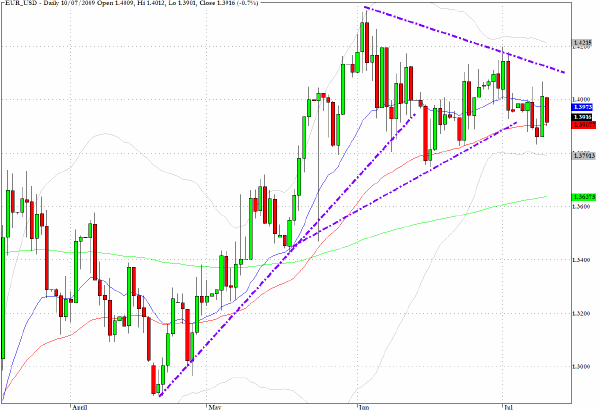
The dollar came under fire yesterday during the North American trading session with some big moves from sterling in particular which moved up almost 300 pips during the session and the Euro which touched $1.4070 during the session.
The chart below shows the followup to yesterday’s US session and indicates, at least at present writing, a reversal formation.
Medium-term forecast is for a move up towards $1.42 but with an increasing probability of a failure within a technically vulnerable pattern.
CNBC is carrying a story on its web site which says Pros see risk of sovereign default in major economies. This could keep the appetite for euro and sterling contained even though those running trading books at the major banks will tend to dismiss all such doomsday scenarios when trying to hit their targets.
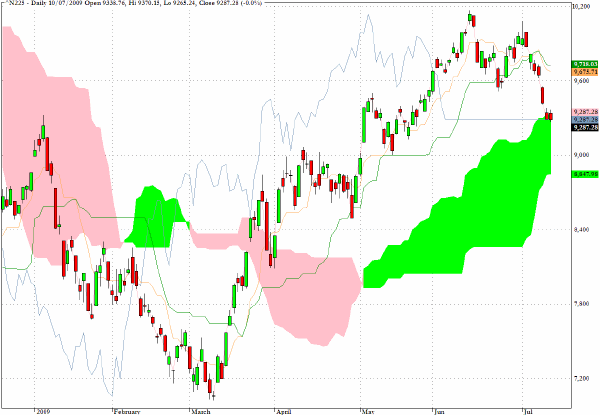
After relative out-performance for several weeks, the Nikkei 225, having failed to crack the 10,000 level, has joined other global indices in a corrective phase which has now brought the index within the green cloud as revealed on the Ichimoku chart.
The bottom of the cloud around 8850 also coincides with other chart support/resistance levels.
Yields on Treasuries have been bouncing around during the course of the week as a result of the auction activity of the US Treasury. The results of the 10-year auction on Wednesday gave rise to a major sigh of relief which brought the yields down almost 20 bps on the session.
The 30-year auction held yesterday was less successful and underlines the fact that the average duration of holdings across the Treasury-yield spectrum continue to shorten. This is just another symptom of the unease that is accompanying the financing of mounting deficits and is causing consternation among those responsible for managing the structuring of maturities in the public sector, not only in the US but also in other indebted nations. Yields at the long end in the UK jumped about 20 bps yesterday.
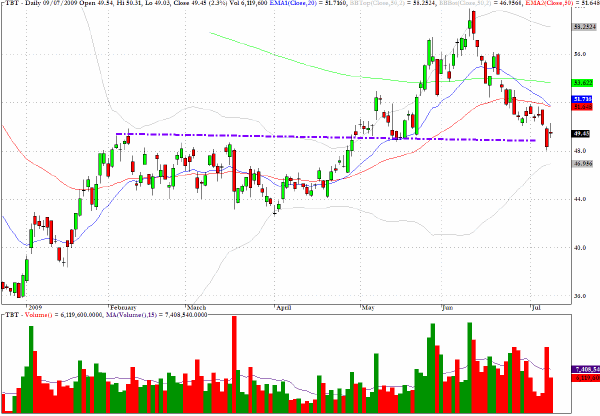
The TBT chart which tracks the yield on 20+ year Treasuries could be ready for a bounce but as the risk aversion looms this is a market to be stoical about at present.
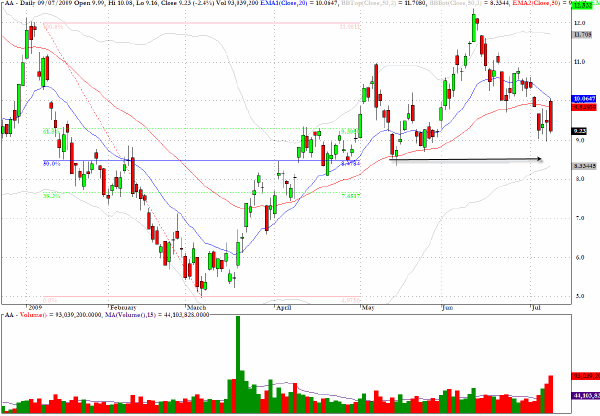
There was a lot of spinning yesterday of the AA earning statements with many trying to find a silver lining to essentially a downbeat statement. Traders were not buying the recovery story and the medium-term target would be around $8.50 which is the 50% retracement level indicated on the chart.
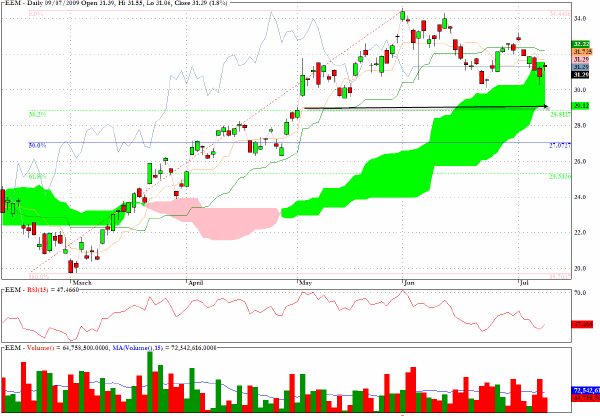
EEM, the sector fund which tracks the MSCI Emerging Markets Index, appears to be vulnerable to a further retreat to the area indicated by the arrow on the chart below.
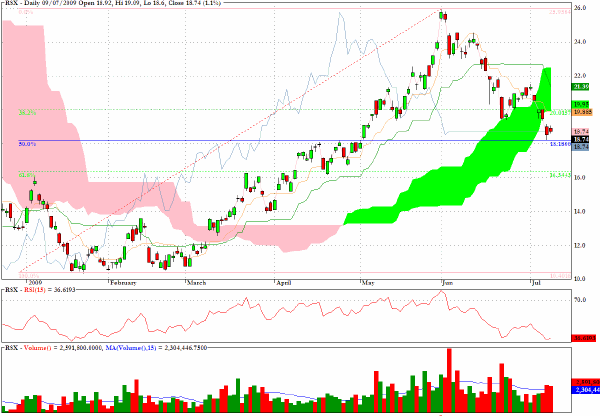
In late June I made the following comment: "RSX, a geographical sector fund which allows exposure to primary Russian equities, is also revealing evidence of an emerging bear flag."
As can be seen, the sector fund has dropped sharply through the cloud and bounced at the 50% retracement level where it may attempt to stabilize, although chart resistance levels from March and April suggest that a 62% retracement could eventually unfold in this market.
Clive Corcoran is the publisher of TradeWithForm.com, which provides daily analysis and commentary on the US stock market.
|