| Corcoran Technical Trading Patterns For July 13 |
| By Clive Corcoran |
Published
07/12/2009
|
Stocks
|
Unrated
|
|
|
|
Corcoran Technical Trading Patterns For July 13
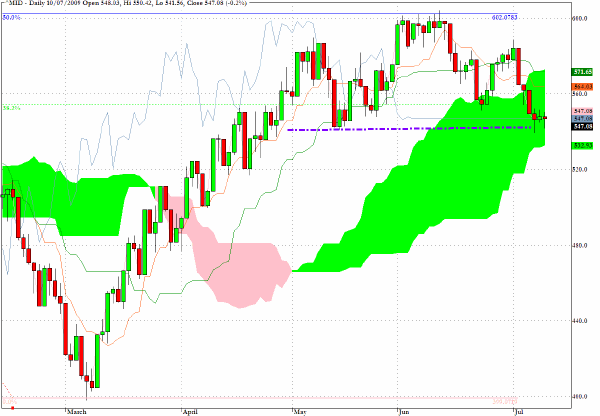
The daily chart for the S&P Midcap Index (MID) below includes a fibonacci grid inserted with the high level of 805 which is taken from early September 2008, prior to the Lehman collapse and before the market began the cascading drops last fall.
From the March 6 low, at almost exactly 400, the index moved to the 50% retracement level just above 600 where it met strong resistance.
The recent price action has brought the index back below the 38% retracement level and deeply into the green Ichimoku cloud. In essence the picture being painted is one of a bear market rally which is on the verge of rolling over, and this is more noticeable on this index than the more widely followed sibling index the S&P 500.
As also illustrated on the chart, Friday’s close brings the index down to a quite critical level astride a horizontal line of support which was successfully tested in mid May.
The big picture Ichimoku interpretation could deliver further emphasis to the broken rally thesis if the 530 level is taken out, and in current conditions it is easy to contemplate that this level could well be tested this week.
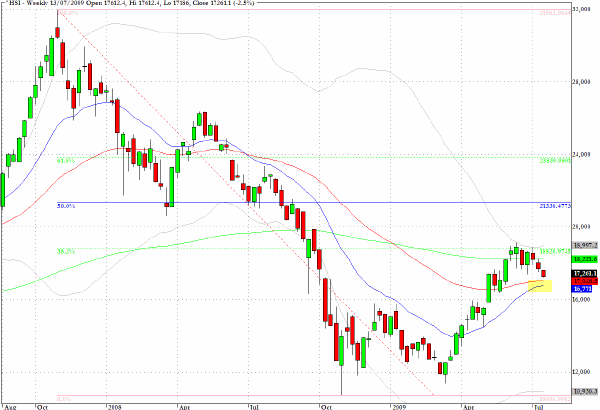
Asian markets dropped again in Monday’s trading and the Hang Seng Index closed the session with a 2.5% loss.
The weekly chart below illustrates the difficulty which this index has encountered at the 38% retracement level from the historic high and the March low.
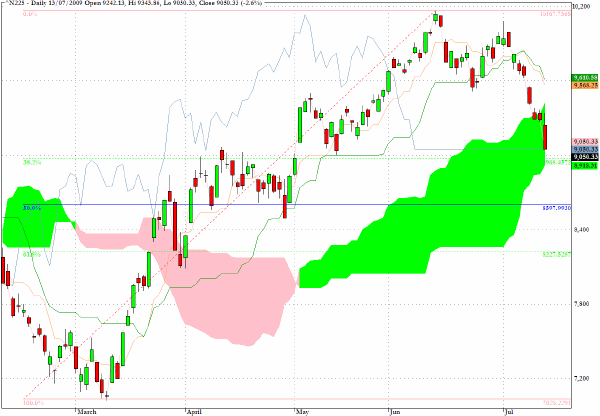
The Nikkei 225, discussed here on Friday, has continued to drop towards the 8850 level as an area of potential support.
A couple of news items are worth touching on this morning as these will have some influence on both the second largest economy’s immediate outlook, and also will impinge on the US dollar as global reserve currency debate, a topic which I have touched on several times both here and in several articles which have been published elsewhere.
It is being reported today that Japan’s Prime Mininster Taro Aso, has called for a general election after disastrous local election results increased expectations that his party’s half-century of almost uninterrupted government is nearing an end.
Aso told leaders of his Liberal Democratic party he was planning to dissolve the lower house of parliament next week and hold a general election on August 30.
The following story is being reported by Bloomberg, regarding the likely successor government, and will provide further question marks for forex and US Treasury traders to ponder.
July 13 (Bloomberg) -- Japan’s opposition party, leading in polls ahead of next month’s election, said the nation should consider shifting its $1 trillion of foreign reserves away from the dollar and buying International Monetary Fund bonds.
“In the medium to long term, we need to do what we can to avoid the risk of currency losses or economic turbulence that could result if the dollar were to swing,” Masaharu Nakagawa, the shadow finance minister in the Democratic Party of Japan, said in an interview in Tokyo on July 9. “Many countries are starting to diversify their reserves.”
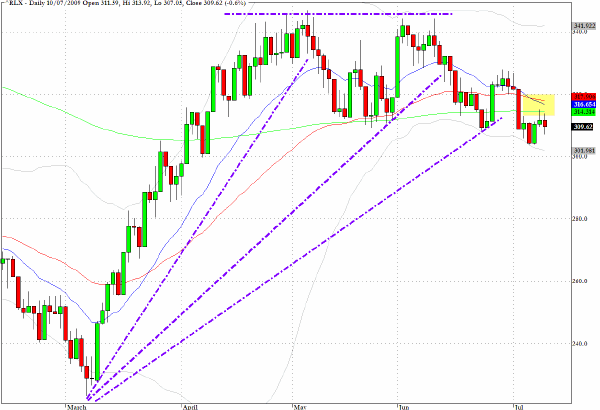
The S&P Retail Index (RLX) displays a fan-like pattern of uptrend violations. The current pattern could see a pullback channel evolve further with the likelihood of another failure being added to the fan.
The 50-day EMA (red line) crossed the 200-day EMA in mid-May, however the current configuration of the exponential moving averages is pointing towards a more bearish crossover ahead.
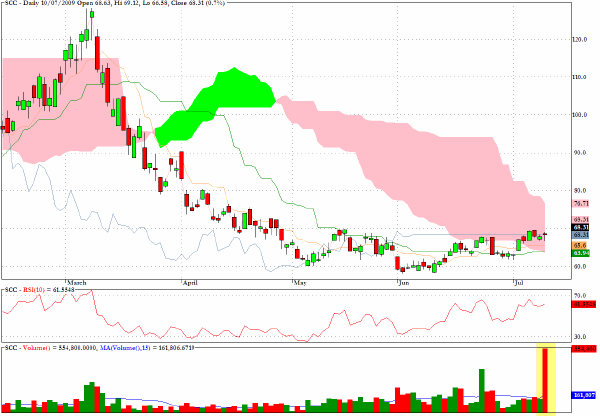
Several of the Ultra short exchange traded funds are displaying extended basing patterns including SCC, which is an inverse and leveraged fund for benefiting from weakness in the consumer services sector.
As can be seen in Friday’s action the volume exceeded three times the daily average.
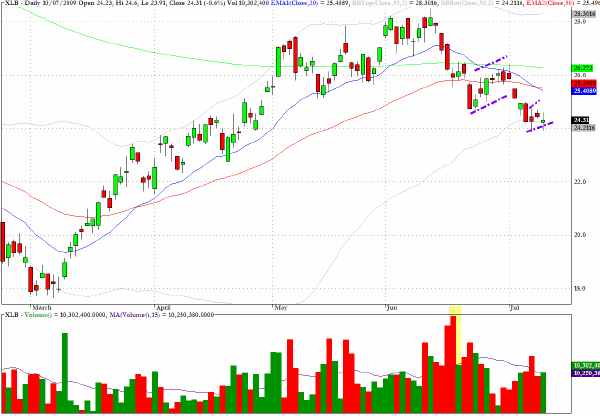
XLB, an exchange traded fund which tracks early cyclicals is evolving a second bearish flag formation and could be in the process of forming a pattern which I called the downward staircase in Long/Short Market Dynamics .
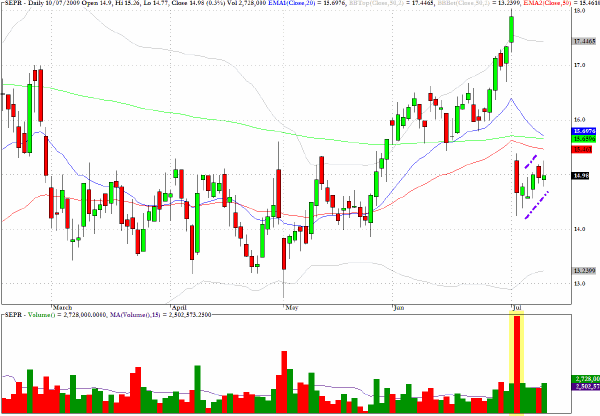
Sepracor (SEPR) would be worth monitoring for entry opportunities on the short side.
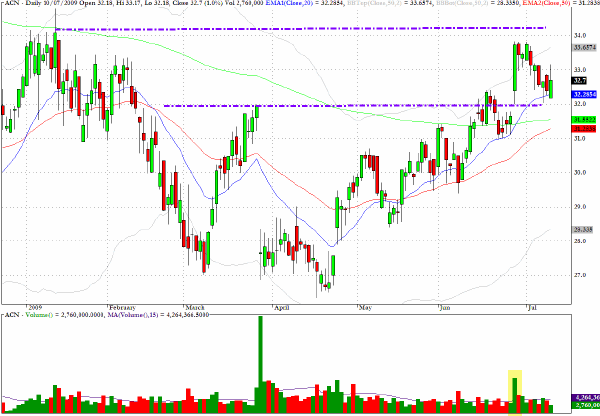
Accenture (ACN) has a bullish flag formation and with support at the $32 level a re-test of the early 2009 highs seems probable.
Clive Corcoran is the publisher of TradeWithForm.com, which provides daily analysis and commentary on the US stock market.
|