| The Wagner Daily ETF Report For July 13 |
| By Deron Wagner |
Published
07/12/2009
|
Stocks
|
Unrated
|
|
|
|
The Wagner Daily ETF Report For July 13
Stocks closed out the week with a slow, inconclusive trading session that was as unremarkable as the previous day's action. The major indices lazily oscillated in a tight, sideways range throughout the entire day, before settling with mixed results. The Nasdaq Composite edged 0.2% higher, as both the S&P 500 and Dow Jones Industrial Average lost 0.4%. The small-cap Russell 2000 advanced 0.4%, but the S&P Midcap 400 Index slipped 0.2%. All the main stock market indexes finished slightly above the middle of their intraday ranges.
Turnover declined from already apathetic levels, making it one of the slowest days in weeks. Total volume in the NYSE eased 8%, while volume in the Nasdaq was similarly 10% lighter than the previous day's level. Volume exceeded average levels only once last week, representative of the summer doldrums kicking into full swing. Moreover, institutions were waiting on the sidelines ahead of a nimiety of quarterly earnings reports from market-moving companies, many of which are on tap this week. Like the stock market's price action, market internals were mixed last Friday. In the NYSE, declining volume exceeded advancing volume by a margin of 2 to 1. The Nasdaq adv/dec volume ratio was positive by 3 to 2.
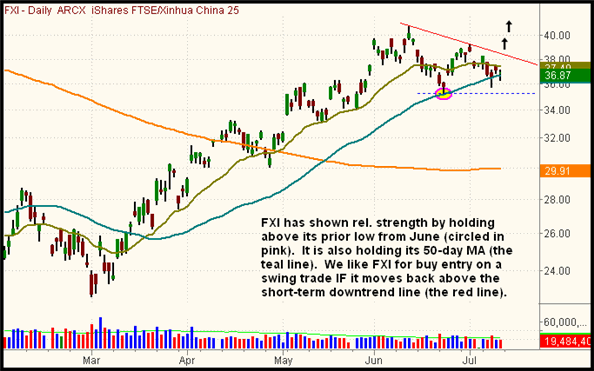
Most international ETFs have moved roughly in lockstep with the weakness in the domestic markets in recent weeks. However, iShares Xinhua China 25 (FXI) continues to show relative strength to the U.S. broad market. The S&P 500, Dow Jones Industrial Average, and Nasdaq Composite are all trading below their 50-day moving averages, and have just fallen below their prior lows from June to form new "swing lows." Comparatively, FXI continues to hold above support of its 50-day MA, as well as its prior low from June. When the overall domestic market starts to bounce from its recent weakness, FXI could show clear leadership on the upside. On the daily chart below, we've illustrated a potential buy entry point for a short-term swing trade in FXI:

For those not familiar with the various Chinese ETFs, the portfolio of FXI is comprised of a small basket of stocks that trade on the mainland Shanghai Stock Exchange (SSE). For the sake of simplicity, think of the Xinhua index as the Chinese equivalent to the Dow Jones Industrial Average. Sporting a similar chart pattern to FXI, but different "under the hood," is SPDR S&P China (GXC), whose portfolio consists of more than 100 individual stocks. FXI is tied to the performance of just 25 stocks. Although FXI is more widely traded than GXC, some may prefer the greater diversification of the latter's portfolio.
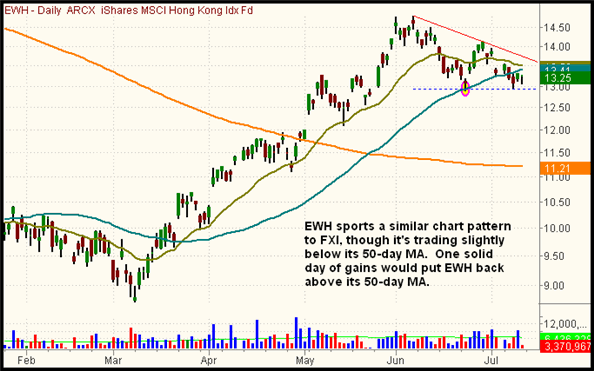
The iShares Hong Kong Index (EWH) is technically a Chinese ETF as well, but is obviously composed of stocks traded on the Hong Kong Stock Exchange (HKEX). As with FXI and GXC, EWH is still holding above its prior low from June, though it slipped below its 50-day MA last week. Still, EWH is trading below its 50-day MA by just a narrow margin; one solid day of gains would propel the ETF back above the pivotal moving average. As such, you may also want to add EWH to your watchlist of ETFs exhibiting relative strength during the current correction in the U.S. markets:

As for the technical picture of the main stock market indexes, nothing has really changed since our last update. The S&P, Dow, and Nasdaq are all below their 50-day moving averages, while the S&P struggles to cling to its 200-day moving average. While it's positive the S&P 500 is showing resilience at pivotal support of its 200-day moving average, the most important point is the index remains below the "neckline" of its dominant head and shoulders pattern, which we've discussed numerous times over the past two weeks. Unless that situation changes, one could expect a continued neutral to downward bias in the short-term of the broad market. As we've recently illustrated, a 50% price retracement from the March 2009 lows to June 2009 highs is certainly realistic. That would give the S&P a downside price target around the 810 area. However, it could certainly be bumpy along the way, especially considering the potential for curveballs thrown by the upcoming batch of corporate earnings reports.
Open ETF positions:
Long - INP, TLT, DXD
Short - (DXD is an inversely correlated "short ETF")
Deron Wagner is the Founder and Head Trader of both Morpheus Capital LP, a U.S. hedge fund, and MorpheusTrading.com, a trader education firm.
|