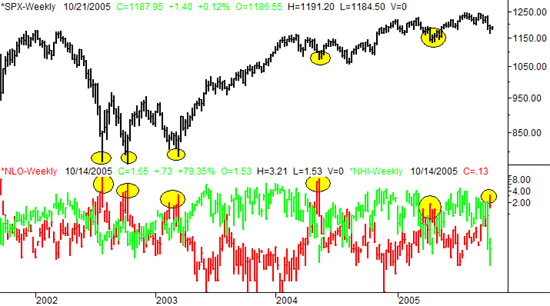
In this week's Weekly Outlook in the Stock Market, we mentioned that there were 324 NYSE stocks that hit new lows on Wednesday. We didn't get to discuss it in detail then, but we suspected that might raise a few questions about why that could be bullish. Sure enough, we got a few. So today, we'll take that detailed look at how a high degree of new lows often signals a market bottom.
The question is just one of extremes - at what point does the market say 'enough already', and turn things around? In the case of new lows and new highs, there is no hard and fast rule, but we do know (as sentiment analysts) that markets tend to hit a bottom when fear - and selling - seems to be at its worst.
On the weekly chart below, we've plotted the S&P 500 on the top. On the bottom half of the chart, we've plotted the weekly NYSE new lows in red, and overlaid that with the NYSE new highs in green. As you may suspect, there tend to be more new highs when the market is rising, and more new lows when the market is falling. But what happens when the new highs and new lows get downright out of whack? Well, based on history, that's about the time that things turn around.
On the chart, the extremely high readings of new lows are highlighted in yellow. Since mid-2002, there have been six instances where there were more than 200 new NYSE lows in a day, and five of those days actually saw more than 300 new lows. In each of those prior cases, stocks made at least some sort of bottom.....and most of those were major bottoms. The jury is still out on last Wednesday's new lows, but so far, it looks like it's leading to similar results.
S&P 500, New NYSE Highs, New NYSE Lows - Weekly
So what's the magic number? There isn't one, at least not that we're aware of. But in general, it's pretty clear that new lows in the 300 range usually occurs at a bottom. What's interesting at this point is that last Wednesday's 324 new lows is about the same number was saw in March of 2003, which actually wound up being the bottom of the bear market and the beginning of the bull market. To get that kind of capitulation in 2003 (at the end of a three year drought for stocks) is understandable. But to see it after what was nothing more than a garden variety correction? That's uncanny. Yet, we can't downplay the subtle significance of that reading. Maybe it was a whimpering end to a lethargic period, and a setup for a huge upside move. I think it's still too soon to make that call though.
On the other hand, I think it's a mistake to expect big, grandiose, clear indications of the early stages of a new trend. The market is sneaky more often than it isn't, so it wouldn't surprise me at all to see that this unsung new lows data is actually much more meaningful than anybody thought it could be. To fuel that contrarian fire is the fact that almost all investors are convinced that stocks are facing a nearly-impossible road ahead. You ever heard that it's always darkest right before dawn? Inflation seems to be rampant, the economy is slowing down, yet the Fed is still raising rates. Those are the typical reasons people stay out of stocks.......which means that any would-be sellers are probably already out of the market. That's possibly what happened on Wednesday. As such, that would leave only the buyers behind. If that's the case, stocks should encounter very little resistance or profit-taking on the way up. We'll see.
Price Headley is the founder and chief analyst of BigTrends.com.