| Corcoran Technical Trading Patterns For July 14 |
| By Clive Corcoran |
Published
07/14/2009
|
Stocks
|
Unrated
|
|
|
|
Corcoran Technical Trading Patterns For July 14
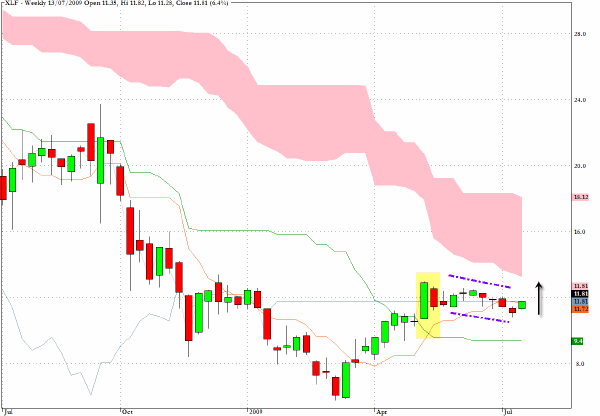
The weekly chart on the financial services sector fund, XLF, reveals an extended pullback pattern following the long highlighted green candlestick in early May.
I have always been slightly cautious about identifying bull flags on weekly charts - especially if the pullback pattern is too protracted, but if we give this pattern the benefit of the doubt, the highlighted move amounted to 22% from the base of the flagpole to the top and extrapolating that to current levels would, even after allowing for yesterday’s 6% move, probably enable this troubled sector to challenge the pink cloud formation from below for the first time on its weekly chart since 2007.
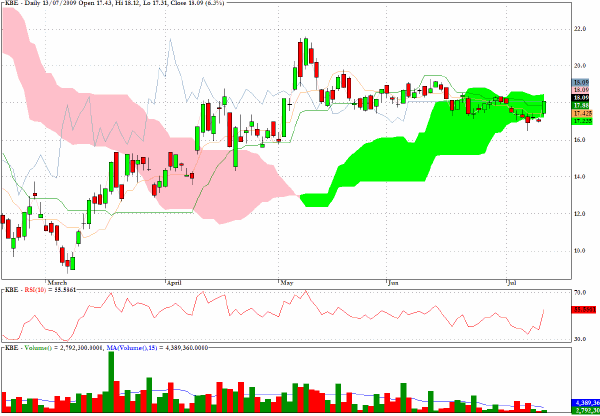
KBE, which tracks the KBW Banking Index, had an unexceptional day, from a volume perspective, which suggests that those expecting a rally for financials will need to be selective and not rely upon this being a simple matter of jumping head first into the banking sector.
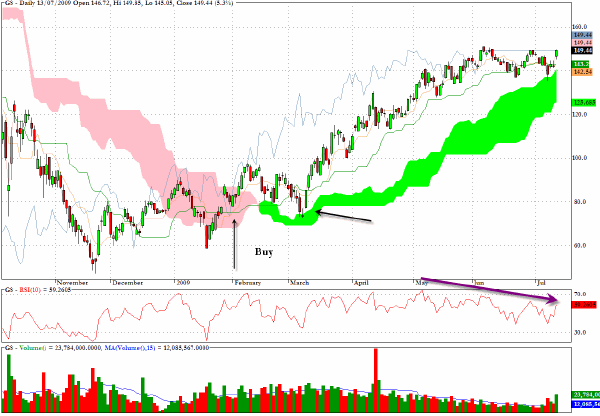
A lot of attention will be focused on Goldman Sachs (GS) today. The long term Ichimoku chart is quite revealing on this extraordinarily well positioned firm that embodies our culture’s fascination with financial technocracy.
1. There is a buy signal indicated in early February.
2. Despite the retreat for the overall market in early March, GS managed to remain above the green cloud even when it tested as indicated by the arrow on the chart.
3. Recent RSI readings are diverging from the price action which seems ready to take out the $150 level.
4. Longer-term weekly charts show a lot of congestion and previous support/resistance around $160.
Today’s positive earnings may have been largely anticipated by the markets, with the possibility that some will be looking to book profits. However, most fund managers are in awe of this company because of its "special relationship" with the US government and to slightly paraphrase the old adage about GM - whatever is good for the US will be even better for Goldman Sachs.
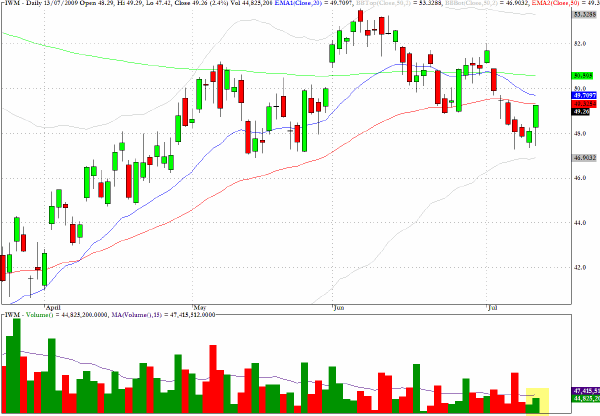
The proxy for the Russell 2000 (IWM) put in a nice bounce yesterday but the volume was below average.
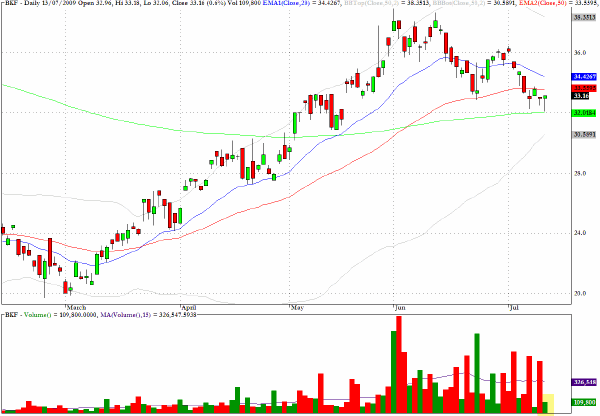
The MSCI Bric fund, BKF, managed to find support at exactly the 200-day EMA level but once again the volume figures for this ETF were just one third of their daily average.
Clive Corcoran is the publisher of TradeWithForm.com, which provides daily analysis and commentary on the US stock market.
|