| The Wagner Daily ETF Report For July 15 |
| By Deron Wagner |
Published
07/15/2009
|
Stocks
|
Unrated
|
|
|
|
The Wagner Daily ETF Report For July 15
Major averages pulled back during the first ninety minutes of trading, which turned out to be a mild gut check for the bulls, as stocks reversed back up to the highs of the day through lunch. The afternoon session failed to provide any follow-through, as broad market averages chopped around near the highs of the day until the close. The S&P Midcap 400 and small-cap Russell 2000 finished up 0.8% and 0.7% respectively. The S&P 500 gained 0.5%, while the Dow Jones Industrial Average and Nasdaq Composite both closed 0.3% higher.
Total volume eased off the prior day's pace by 2% on the Nasdaq, but dropped 16% on the NYSE. We view Tuesday's lighter volume advance as more of a positive sign overall, as stocks managed to reverse the early selling pressure and hold on to Monday's strong gains. Market internals were mild, as upvolume beat downvolume by a 2 to 1 margin on the NYSE and 1.7 to 1 on the Nasdaq.
While broad market averages attempt to push through downtrend line and moving average resistance, the HOLDRS Semiconductor ETF (SMH) is already trading above all major moving averages:
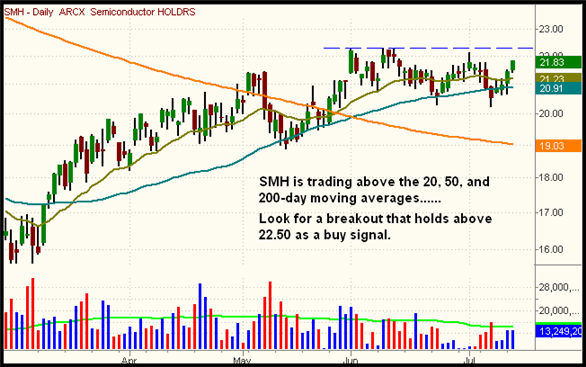
SMH has formed a tight-range consolidation above the 50-day moving average (in teal). This short-term pattern has held up much better than the major averages during the selloff. Looks as if SMH is poised to open above the range highs tomorrow morning, as it closed at 22.50 in after-hours trading. If SMH does gap higher on the open, make sure the gap holds over the first 20-minutes of trading before establishing a position. ProShares Ultra Semiconductors ETF (USD) is another option to play a potential semiconductor breakout with a move above 21.60.
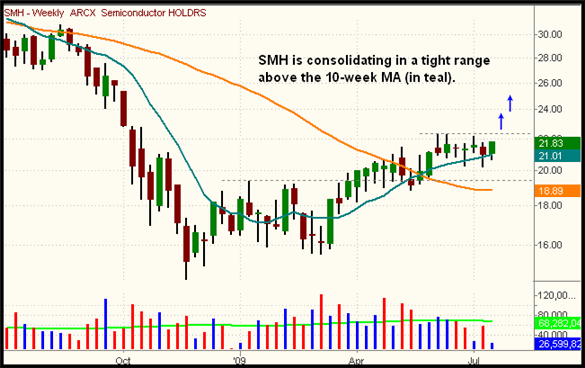
SMH weekly chart shows the tight action over the past six weeks:
Another setup showing relative strength that is poised to break out from a tight ranged consolidation is the iShares Turkey ETF (TUR). The sideways correction basically held above the 20-day EMA, retracing less than 15% of the last move up.
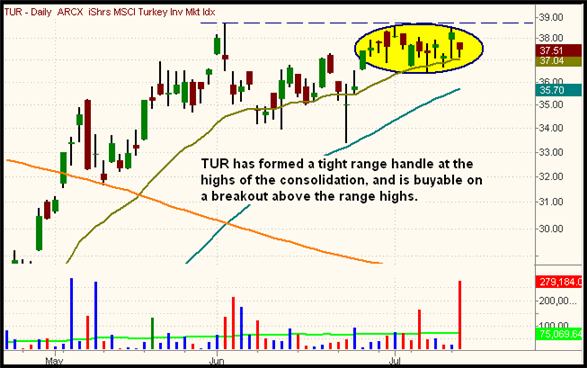
For those traders who do not feel comfortable buying breakouts, one could always take a half position on the breakout and add the remaining half position on the first pullback to reduce risk.
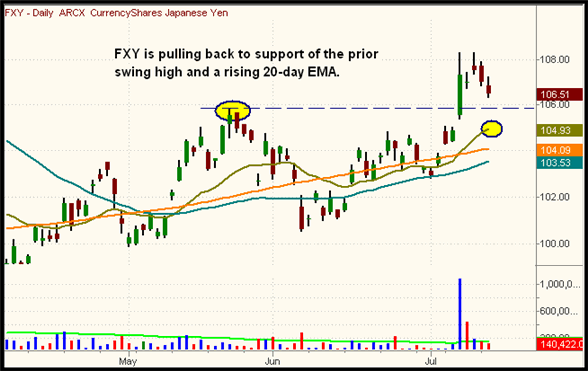
Speaking of pullbacks, after breaking out above 106.00 on big volume last week, FXY is pulling back on lighter volume to support. Look for a test of the prior swing high just above the rising 20-day EMA as a potential low-risk entry point (105.00-106.00 area). Exit the position on a break down below the 20-day EMA, as this would signal a false breakout.
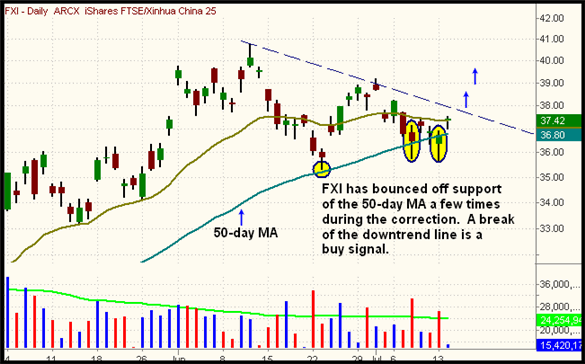
Look for China to once again lead the way if US markets can break through resistance. The iShares Xinhua China 25 (FXI) is buyable on a move above the downtrend line on the daily chart below.
Intel (INTC) blasted higher on better than expected earnings after the bell, which launched the Nasdaq futures up 30 points by 5 p.m. (S&P 500 futures were up 12 points). We could potentially see the S&P 500 trading at or above resistance of the 50-day MA and the downtrend line (mentioned in yesterday's report) on the open. If this gap holds up during the first 20-minutes of trading, then we would expect the rally to gain momentum and push higher in the short-term. If the gap up fails, then all bets are off to the long side.
Open ETF positions:
Long - INP, TLT
Short -
Deron Wagner is the Founder and Head Trader of both Morpheus Capital LP, a U.S. hedge fund, and MorpheusTrading.com, a trader education firm.
|