| Corcoran Technical Trading Patterns For July 16 |
| By Clive Corcoran |
Published
07/16/2009
|
Stocks
|
Unrated
|
|
|
|
Corcoran Technical Trading Patterns For July 16
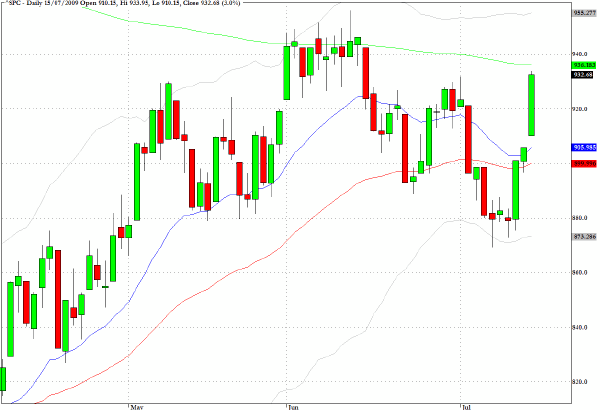
Equity markets once again demonstrated that short squeeze rallies, where a large number of traders had convinced themselves that the market was about to plummet and had to rush to cover, can be viciously abrupt and result in the kind of powerful trend day that was registered on the S&P 500 chart yesterday.
We have rallied from the test of key pivot levels around 875 and back to within a whisker of the 200-day EMA in just three sessions. No wonder a company like Goldman Sachs, which has the inside edge in this arena of highly technical trading, can produce such spectacular results.
Questions about the sustainability of the rally and the technical patterns seem to be eclipsed by the fact that GS has a target of 1050 or thereabouts on the S&P 500 and, increasingly it seems, that GS gets exactly what it wants.
I shall leave the reader to decide whether, in the fullness of time, this is healthy for a sound capital allocation mechanism - the primary rationale for markets - or just for clever meta-market timing activities.

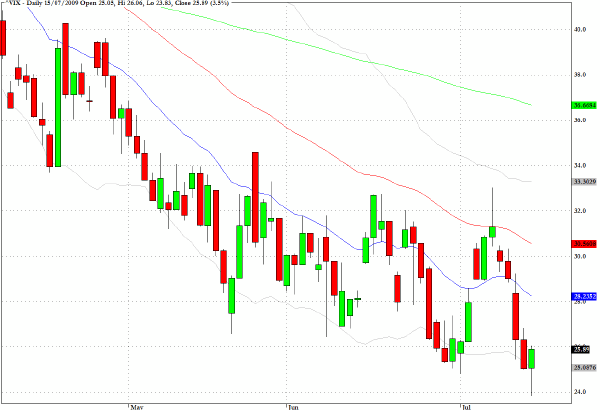
Despite a three percent rally in the S&P 500, the VIX actually rose in yesterday’s session. This is not a common occurrence as these comments from Bloomberg suggest.
The Chicago Board Options Exchange Volatility Index, as the VIX is known, gained 3.5 percent to 25.89. The S&P 500 added 3 percent, giving it a 6.1 percent gain since July 10. They have both advanced 25 times since the subprime crisis began in August 2007, according to data compiled by Bloomberg. The next day, the S&P 500 fell 18 times for an average loss of 1.6 percent.
“That is remarkable,” Randy Frederick, head of trading and derivatives at Charles Schwab in Austin, Texas, said of the tandem move by the S&P 500 and VIX today. “The VIX is expecting something here, either a pull back this afternoon or tomorrow.”

Inter-market strategies seem to be flourishing with a kind of predictability which makes some uneasy. This is related to the phenomenon of increasing correlations across different asset classes where the common denominator is the prevalence or absence of risk aversion.
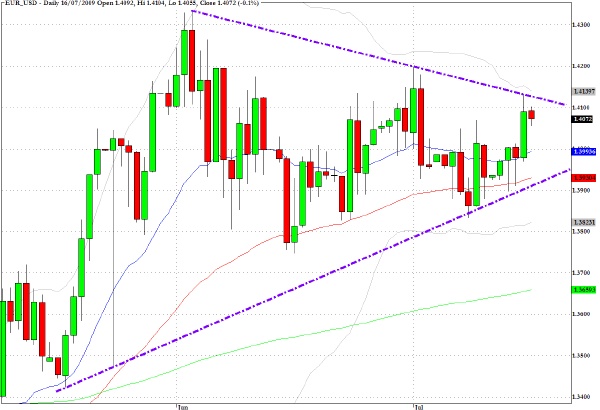
When US equities surge, so too do many of the key foreign currencies. The chart of the Euro reveals that the triangular pattern is counter-cyclical to the movements in broad equity markets. The euro tagged the top of the triangle yesterday and is pulling back in Thursday’s session as this is being written.
If the S&P is set to break to the upside one should be looking for forex traders to echo that breakout by pushing the euro back towards 1.47 which was seen last December.
Personally I still remain skeptical about that.

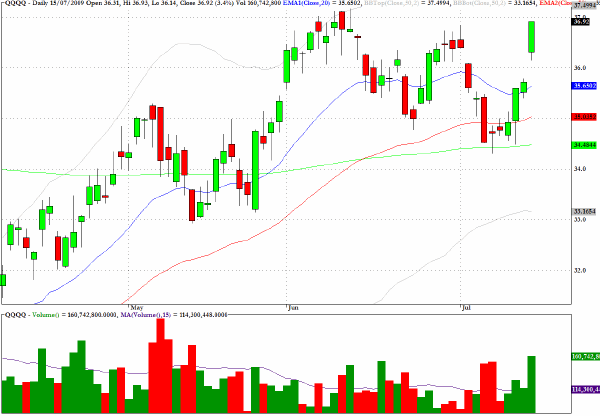
The technology sector, in the wake of Intel’s earnings and outlook, propelled the markets higher yesterday and QQQQ had reasonably healthy volume behind the move.
The Nasdaq 100 proxy has gone from a test of the 200-day EMA and back to the recent highs in just three sessions.
As previously commented, trading in today’s markets is really suited to those with a bi-polar temperament and the daily dynamics of half full/half empty should forever banish the efficient market’s hypothesis (EMH) to the scrap heap of pseudo-scientific mythology.

Clive Corcoran is the publisher of TradeWithForm.com, which provides daily analysis and commentary on the US stock market.
|