| The Wagner Daily ETF Report For July 17 |
| By Deron Wagner |
Published
07/17/2009
|
Stocks
|
Unrated
|
|
|
|
The Wagner Daily ETF Report For July 17
The major indices followed up Wednesday's breakout with another session of gains, confirming the legitimacy of this week's rally above key areas of technical price resistance. Stocks consolidated in a tight, narrow range throughout most of the day, before surging higher in the final two hours of trading. The Nasdaq Composite gained 1.2%, the Dow Jones Industrial Average 1.1%, and the S&P 500 0.9%. The small-cap Russell 2000 advanced 1.3%, as the S&P Midcap 400 climbed 1.4%. All the main stock market indexes settled in the upper 20% of their intraday highs.
Total volume in the NYSE declined 13%, while volume in the Nasdaq was 18% below the previous day's level. Higher turnover would have marked a second straight day of accumulation in the S&P and Nasdaq, but it's common for volume to ease on the day following a breakout in the market. Market internals were solid. In the Nasdaq, advancing volume exceeded declining volume by nearly 3 to 1. The NYSE adv/dec volume ratio was positive by approximately 3 to 2.
As discussed in yesterday's commentary, the stock market's bullish price action on July 15 caused the major indices to surge above key resistance levels, giving us the signal to selectively start buying again. Although a vast majority of stocks and ETFs are moving up right now, we're focused primarily on ETFs exhibiting relative strength to the broad market. Specifically, we're interested in ETFs already breaking out above resistance of their June 2009 highs, ahead of the S&P 500 and Dow Jones Industrial Average, both of which are still below their June highs. Nevertheless, after seven straight days of gains in the Nasdaq, the risk/reward of new buy entries at current price levels is not very desirable. Rather, we're primarily targeting strong ETFs for potential buy entries on a pullback.
On the international front, iShares Turkey (TUR) has broken out above resistance of its recent highs, and is now trading at a nine-month high. The daily chart of TUR is shown below:
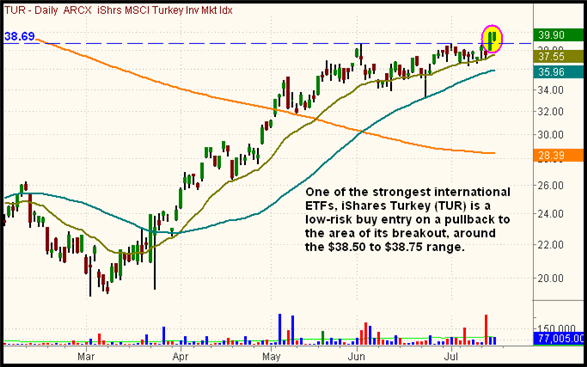
Although TUR could be bought on a rally above the high of the past two days (over $40), such an entry is a little "late to the party," as the breakout entry was above $38.69. As explained in yesterday's commentary, we wanted to be sure the July 15 price action would hold before jumping in on the initial breakouts. As such, we prefer to buy TUR on a retracement that tests support of the breakout level. An entry around the $38.50 area would be ideal.
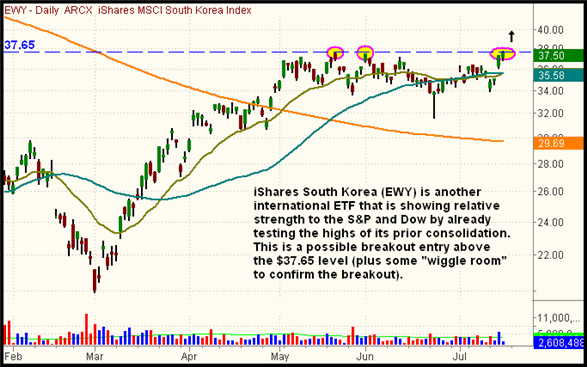
Another international ETF showing nice relative strength to the broad market is iShares South Korea (EWY). Unlike TUR, it has not yet broken out above its June high, but could easily do so within the next several days. With this play, a breakout above the July 16 high of $37.72 is buyable:
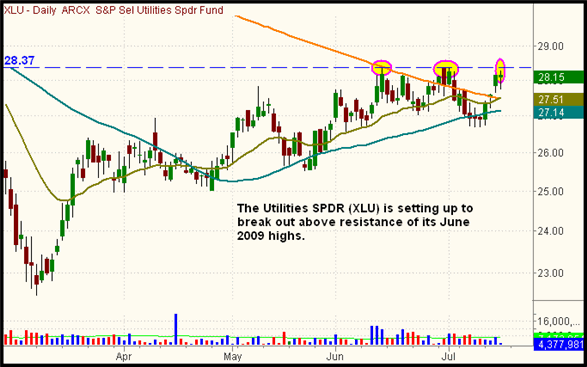
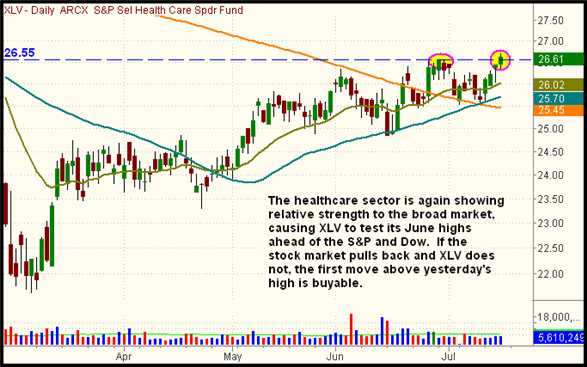
Two domestic ETFs showing relative strength to the broad market are sector-specific ETFs in Utilities and Healthcare. Specifically, we're monitoring S&P Utilities SPDR (XLU) and S&P Health Care SPDR (XLV) for potential breakouts above their June highs. These are in addition to the Semiconductor ETFs, such as the Semiconductor HOLDR (SMH), which we're stalking for pullback entries. The breakout levels in both ETFs are annotated on the charts below:
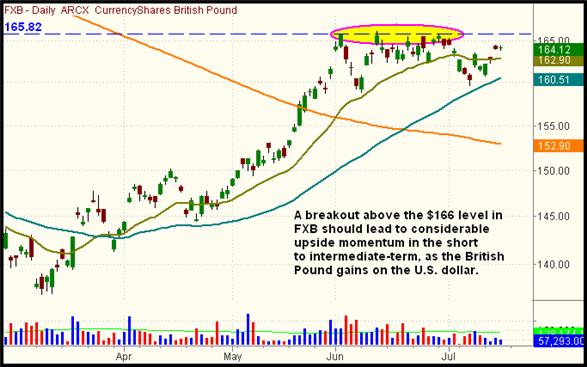
Several currency ETFs have interesting chart patterns that may be setting up for potential buy entry. The U.S. dollar continues to show weakness, which is causing most global currency ETFs to show strength. Two that we like are CurrencyShares British Pound (FXB) and CurrencyShares Japanese Yen (FXY). After recently pulling back to near support of its 50-day MA, FXB has rallied back to resistance of its prior highs from May and June, putting it on our watchlist for potential breakout entry above the highs of the range. The breakout level is illustrated on the chart below:
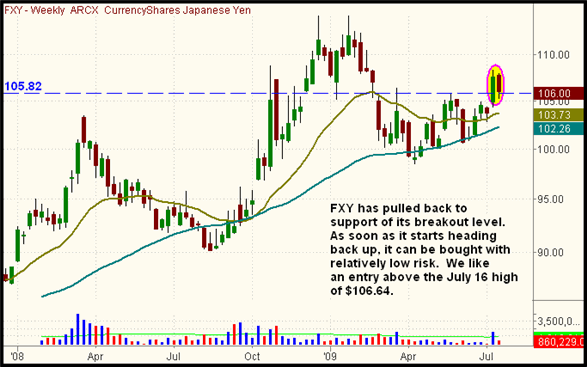
Leading most other currency ETFs, the Japanese Yen Trust (FXY) already broke out above its prior highs on July 8. Since then, it has pulled back to support of its breakout level, "undercutting" the lows of its breakout level on July 15. A rally above the July 16 high of $106.64, above the week-long downtrend line, should lead to a resumption of the dominant uptrend. The setup is shown on the weekly chart of FXY below:
Of the major indices, the Nasdaq brothers (the Nasdaq Composite and Nasdaq 100) are showing the most relative strength, just as they have done for months. Yesterday's rally has already enabled both indexes to close above resistance of their June 2009 highs. This means the Nasdaq brothers have officially entered back into intermediate-term uptrends. The S&P and Dow are still a bit below their June lows, but continued strength in the Nasdaq could pull both indexes into new intermediate-term uptrends as well. For now, the short-term trends in the S&P and Dow are bullish, but the intermediate-term trends are neutral.
Open ETF positions:
Long - INP
Short - (none)
Deron Wagner is the Founder and Head Trader of both Morpheus Capital LP, a U.S. hedge fund, and MorpheusTrading.com, a trader education firm.
|