| The McMillan Options Strategist Weekly |
| By Lawrence G. McMillan |
Published
07/17/2009
|
Options
|
Unrated
|
|
|
|
The McMillan Options Strategist Weekly
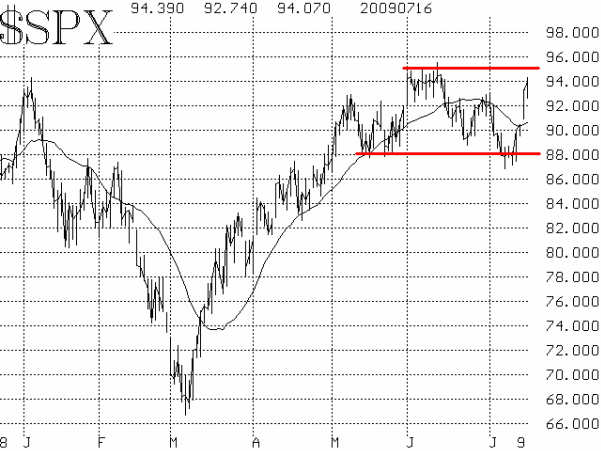
$SPX continues to remain within the confines of its 880-950 trading range on a closing basis. A clear breakout in either direction can and should be "played," but so far the stock market -- it is best contrarian form -- has created the image of false upside breakouts (in early June) and false downside breakouts (in early July). The fact that today $SPX closed above prior resistance at 930 likely means that it is headed for a test of the 950 level. However, a breakout is by no means guaranteed.

Market breadth has been the most accurate indicator in recent weeks. The breadth oscillators that we use are able to swing quickly between buy and sell signals -- something that seems to be necessary in this environment. Buy signals were issued late last week and early this week. But now these same breadth oscillators are very overbought. So it is going to be necessary to keep a close eye on these breadth oscillators.

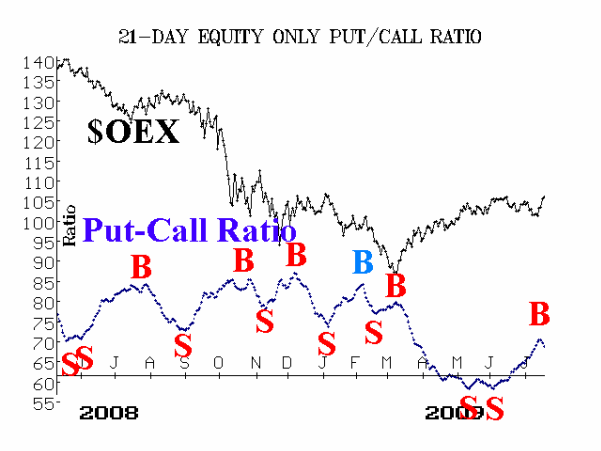
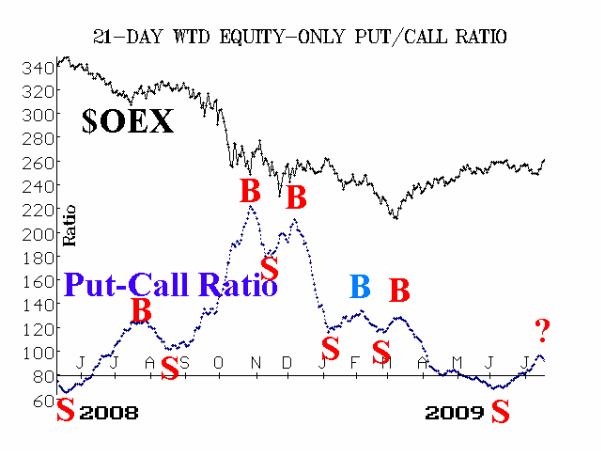
The equity-only put-call ratios had remained on sell signals since early June. But yesterday, the standard ratio rolled over to a buy signal (as confirmed by the computer programs we use to analyze the put-call ratio charts). The weighted ratio hasn't chimed in yet, since the computer program does not rate it as being on a buy at this time; in fact, the computer says there's only a 60% chance that the weighted ratio has rolled over.

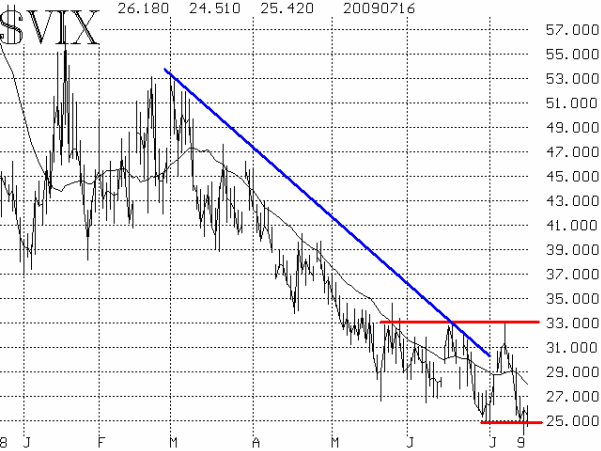
Volatility indices ($VIX and $VXO) have continued to decline, and thus remain bullish. Twice, it has appeared that $VIX was rising and it did indeed break above its downtrend line. But both times, it soon fell back sharply, and thus the general trend of $VIX is still lower -- which is bullish for the stock market. In one sense $VIX is in its own trading range, between 25 and 33.

So, what does this all add up to? A market that's still in a trading range, that's what. A clear breakout over 950 would be bullish, of course, but it frankly seems too early to say that will occur. Right now, the market is too overbought to break out, in my opinion.
So, we'll watch for the next breadth sell signal, or for the breakout over 950. One or the other should occur soon.
Lawrence G. McMillan is the author of two best selling books on options, including Options as a Strategic Investment, recognized as essential resources for any serious option trader's library.
|