|
The Wagner Daily ETF Report For July 22
Throughout most of the day, it looked as though stocks were finally going to break their winning streak, but a late-day push in the final hour of trading enabled the major indices to score another round of gains. Blue chips led the way this time, as the Dow Jones Industrial Average climbed 0.8%. The S&P 500 and Nasdaq Composite posted matching gains of 0.4%. Small and mid-caps lagged. The Russell 2000 lost 0.3% and the S&P Midcap 400 advanced less than 0.1%. All the main stock market indexes again closed near their intraday highs.
Total volume in the NYSE increased 7%, while volume in the Nasdaq was 9% higher than the previous day's level. On the surface, the higher turnover implies yesterday's session was a bullish "accumulation day," but a closer look beneath the surface reveals a different picture. As the stock market was trading in negative territory throughout most of the day, total volume in the NYSE, as of 2:30 pm, was tracking 15% higher. At the same time of day, volume in the Nasdaq was on pace to be 10% higher than the prior day. Then, as stocks rallied in the final ninety minutes of trading, volume actually decreased, finishing the day with lighter volume increases than earlier in the day. This tells us yesterday was actually a session of "churning," where institutions were selling into strength, rather than one of institutional buying. Nevertheless, just one session of bearish "churning" is not enough to derail a strong rally; yet, it's still a noteworthy observation. It's also notable that, in the NYSE, declining volume marginally exceeded advancing volume. The adv/dec volume ratio in the Nasdaq was only fractionally positive.
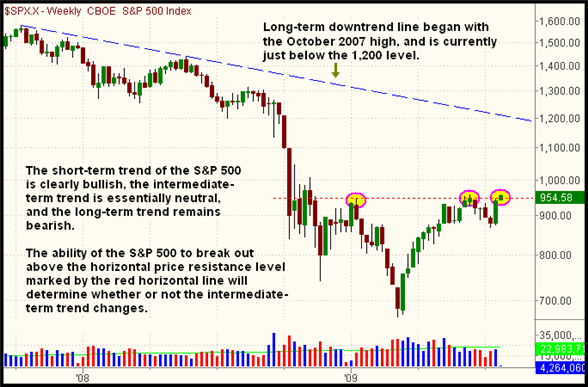
Now that the stock market appears to be entering a new phase of bullishness, let's take an updated look at the longer-term weekly charts of the major indices. The daily charts show the Nasdaq convincingly above its June 2009 high, and the S&P and Dow testing their June highs. But the weekly charts have the benefit of showing the "big picture" of the longer-term trends. We'll begin with looking at a weekly chart of the benchmark S&P 500 Index (moving averages removed so you can more easily see the trendlines):

Obviously, the short-term trend of the S&P 500 has been rather bullish, as the index has logged a gain for seven consecutive sessions. But the key question right now is whether or not the S&P 500 will confirm the breakout above pivotal resistance of its June 2009 high, which roughly converges with its January 2009 high as well. The dotted, horizontal line on the chart above marks the weekly closing high from June 2009. Presently, the S&P 500 is on track for a higher weekly closing price, though the index is still a few points below the absolute high from the middle of last month. Based on recent price action, there's a pretty good chance the S&P will firmly break out above its June 2009 high in the near future. However, a very short-term correction (either a pullback or consolidation) could easily occur first. If the S&P manages to enter into a new, intermediate-term uptrend, by convincingly busting out above its June 2009 highs, bullish momentum could carry the index several hundred points higher, perhaps up to its descending, multi-year downtrend line. Next, take a look at the Dow Jones Industrial Average:

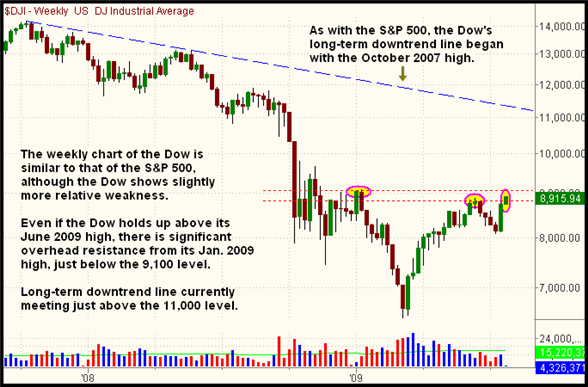
The weekly chart of the Dow is similar to that of the S&P 500. Slight relative weakness in the Dow can be seen, based on the greater depth of its recent correction, as well as the fact that the Dow is still well below resistance of its January 2009 high. Like the S&P 500, the Dow's long-term downtrend line has been in place for nearly two years. Although the Dow is perhaps the most widely discussed index by the financial media, the reality is that it's a narrow-based index of just thirty stocks. Since most sustainable bull markets are led by growth stocks, the performance of the Dow really is really of secondary importance. Still, it acts as an important "psychological indicator" of the overall stock market's health because so many people follow it. Finally, here's the Nasdaq Composite:

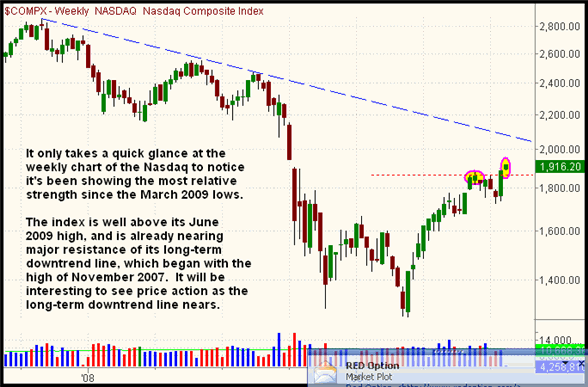
As we've been saying in our commentary for months, the Nasdaq has the most relative strength of the major indices. It is the only one of the three indexes that has already convincingly broken out above its June 2009 highs, meaning the index is in a confirmed intermediate-term uptrend, as well as a short-term uptrend. As such, a pullback to the area of the recent breakout level of the June highs provides a relatively low-risk entry point for new long positions in the Nasdaq. With the Nasdaq rapidly ascending, and the multi-year downtrend line steadily moving lower, we may soon see a test of that pivotal level of long-term resistance. IF the stock market is to see another bearish period sometime this year, resistance of that long-term downtrend line would certainly provide a convenient excuse for such a correction to start. But we won't plan for that until it happens. For now, and as always, we'll trade what we see, not what we think!
Open ETF positions:
Long - FXY
Short - (none)
Deron Wagner is the Founder and Head Trader of both Morpheus Capital LP, a U.S. hedge fund, and MorpheusTrading.com, a trader education firm.
|