| Corcoran Technical Trading Patterns For July 24 |
| By Clive Corcoran |
Published
07/24/2009
|
Stocks
|
Unrated
|
|
|
|
Corcoran Technical Trading Patterns For July 24
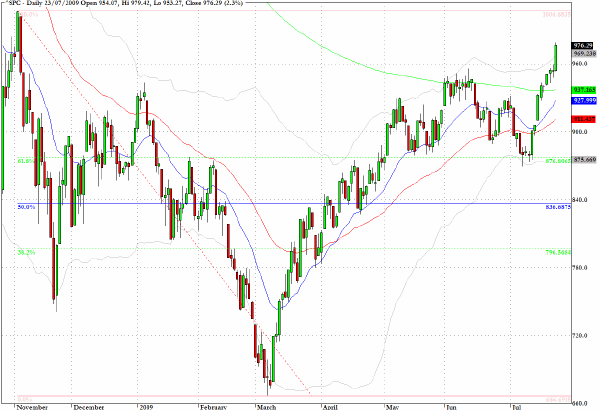
As anticipated in my comments in Monday’s newsletter (available at the archive of Daily Form commentaries), the break above 960 on the S&P 500 is now bringing into play two factors that could perpetuate the surge to 1000 and beyond.
1. Skeptical fund managers are now under the gun to deploy cash and move out of "safe haven assets".
2. Short covering continues and it is notable that some of the recent big movers are stocks that have been out of favor and most troubled during the recent "difficulties" in the financial system.
Goldman Sachs says 1060, and I would not doubt their ability to help steer us there. Meanwhile, the markets will face having to digest almost a quarter of a trillion dollars worth of US government paper being issued over the next week, as outlined in this piece at Seeking Alpha.
70-day CMBs, $30 billion (Friday), 13-week Bills, $32 billion (July 27), 26-week Bills, $31 billion (July 27), 52-week Bills, $27 billion (July 28), 2-year Notes, $42 billion (July 28), 5-year Notes, $39 billion (July 29), 7-year Notes, $28 billion (July 30), 19-year, 6-month TIPS (reopened), $6 billion (July 27).
And the only efforts involved for the Treasury in solicitation of these vast sums is posting a series of PDF files on its website.
This really is 21st century alchemy - let’s hope the game of chicken continues to work.
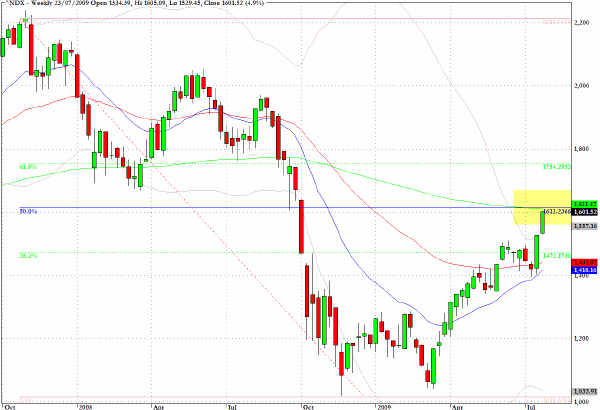
Here for those who missed it is the weekly chart for the Nasdaq 100 which reveals the pace of movement in this index. I commented yesterday that 1610 could be a significant barrier, thinking that it might take a few sessions to get there. It can be seen that the 1610 level corresponds to the 200-week EMA and the 50 retracement of major swing high and low boundaries.
We might be there today, proving just how energized the bulls are at present even if they are bulls of the algorithmic variety!
One of the reasons why I write this daily column is to track and monitor my own performance in trading and to create a chronicle for my own purposes of the way that my own trading style is developing. I have already alluded to the archive of commentaries which contains the last two years of commentaries (I have in fact been writing a daily column for about four years) and readers may have noted that I am becoming more convinced that the Ichimoku techniques can be very beneficial.
The technique and the signals which it gives are more complex than most and I am still a student of this technique. In particular I am finding that it can be helpful in intraday trading of forex.
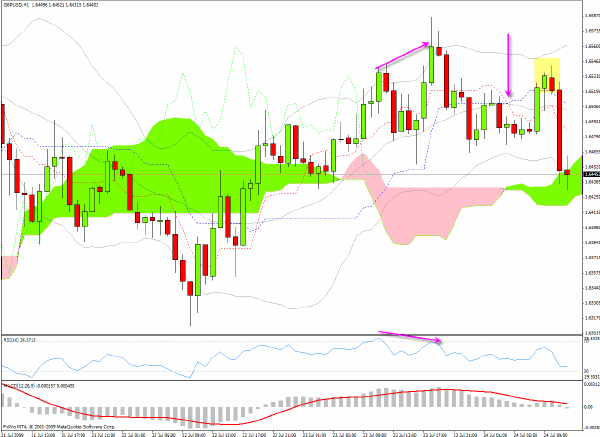
Below is a pattern that has developed on Friday morning in the trading of sterling against the dollar, which echoes the pattern describe here earlier this week.
The Ichimoku sell signal is marked by the arrow, the negative RSI/price divergence is noted by arrows on the chart and the particular entry point is the spinning top candlestick to the right hand side of the chart.
The exit point to the trade is the bottom of the green cloud.
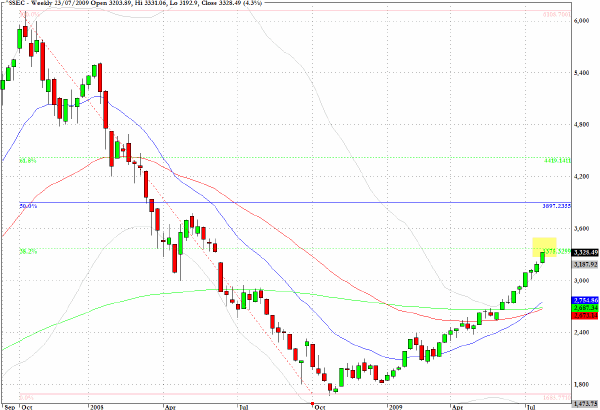
The Shanghai market (SSEC) continues its almost uninterrupted ascent and for reference sake the long-term weekly chart shows that the index is approaching the 38% re-tracement level from the historic high, seen in October 2007, above 6000 and the low one year later below 1800.
At some point this index will need to take a breather.
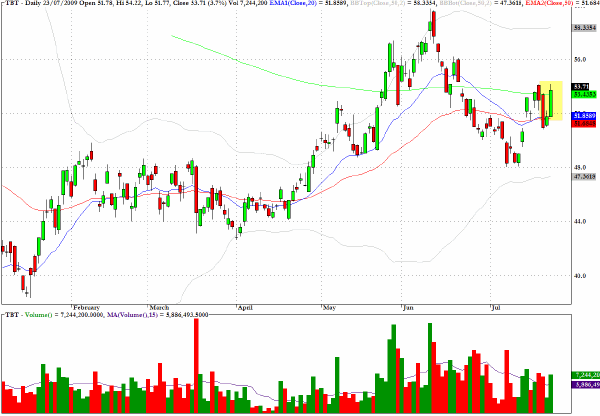
The exchange traded fund, TBT, moves inversely and with twice leverage to the price of 20-plus-year Treasuries.
Based not only the enormous refunding needs above, but also the technical condition of the fund with price breaking above the 200-day EMA, this fund is worthy of consideration again.
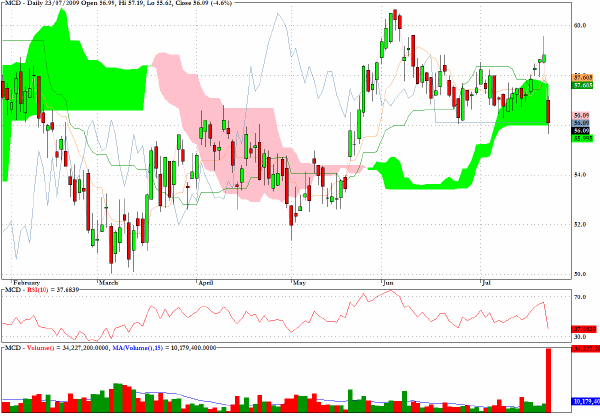
McDonalds (MCD) disappointed yesterday and the selling brought the stock to the bottom of the green cloud on the chart below.
It would not be surprising to see a pullback pattern, but technically this now appears to be one of the more vulnerable of the Dow 30 stocks which is rather incongruent with the general cheerfulness that the recovery process is gaining traction.
As others have said, it is always prudent to trade what you see on the charts and not what you hear about from the pundits.
Clive Corcoran is the publisher of TradeWithForm.com, which provides daily analysis and commentary on the US stock market.
|