| Corcoran Technical Trading Patterns For July 27 |
| By Clive Corcoran |
Published
07/27/2009
|
Stocks
|
Unrated
|
|
|
|
Corcoran Technical Trading Patterns For July 27
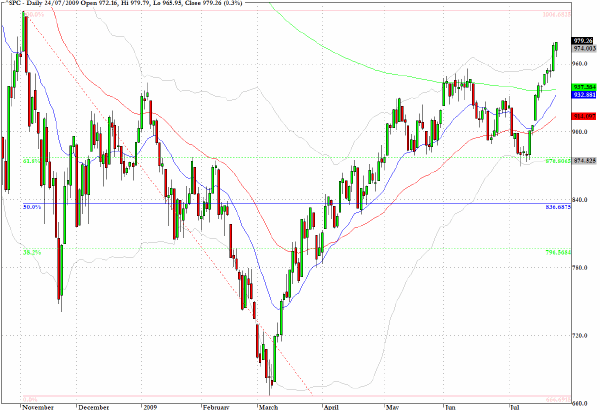
The S&P 500 continues on its upward trajectory and the indicators from overseas action on Monday in Asia and Europe, plus a firm bid on US futures, suggests that the market could continue moving ever closer towards the 1000 target.
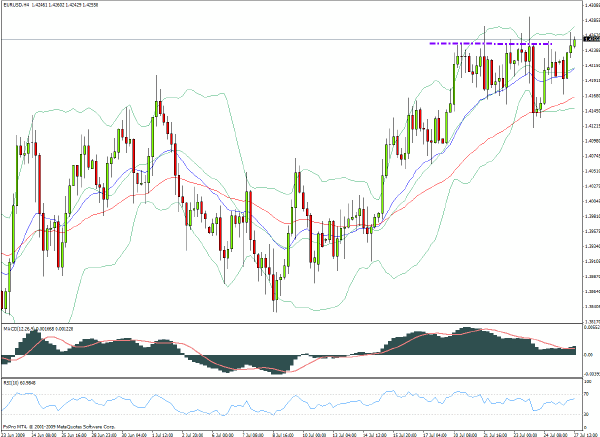
Currencies are also reaching up towards some key levels with the euro poised to challenge the $1.4330 level from early in June.
While the momentum is still favorable for a prolongation of the rally, my concerns are related to the unusual contribution that High Frequency Trading (HFT) may be making to the current technical characteristics of the market. I have expressed this concern this morning in regard to a well written piece at SeekingAlpha about some misunderstandings about HFT and whether the practice amounts to a market which is rigged.
Even if one was to grant all that you claim about the innocence of those using HFT - one of the real issues you have not addressed is the illusion of liquidity that is created by algorithmic activity.
The appearance of high volume and narrow spreads may belie the fact that the underlying "quality" of liquidity (not something that algorithms can really measure) is poor.
For the record, I think that the writer of the piece fails to address some areas where HFT-focused trading houses - and there are obvious names to fit this bill - are benefiting from some unfair advantages, but the larger risks lie in the misperceptions that are being created regarding the technical wellbeing of the equity market.
The real concern would be that - let us say - at the 1000 level a lot of long-only fund managers want to start liquidating positions and the market is faced with a lot of sell orders at the same time - will the algorithms be able to absorb this kind of lopsided and illiquid market environment?

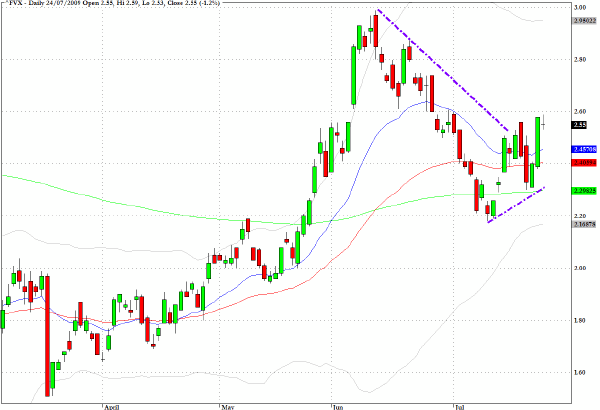
In Friday’s column I enumerated the huge amount of supply that has to be addressed this week in Treasury auctions, and in particular the yield on the five-year note will be worth monitoring.
Friday’s action could not have registered a more appropriate candlestick formation ahead of the challenges ahead than the tiny doji star which is evident on the chart below.
The exchange traded fund TBT is the vehicle to use if you believe that yields across the longer end of the yield curve are poised to move higher.

The intraday chart of the Euro/USD shows that at the time of writing the eurozone currency could be preparing to test the $1.4330 level of resistance that has been discussed previously.
The forex market appears to be lacking some of its normal liquidity as we head into August, when many Europeans are thinking of heading to the beach, and there is a possibility that the Euro will make sharp move up that could trigger some buy stops.
It would be worth holding back to make any diagnosis on a potential breakout until the conclusion of North American trading today.

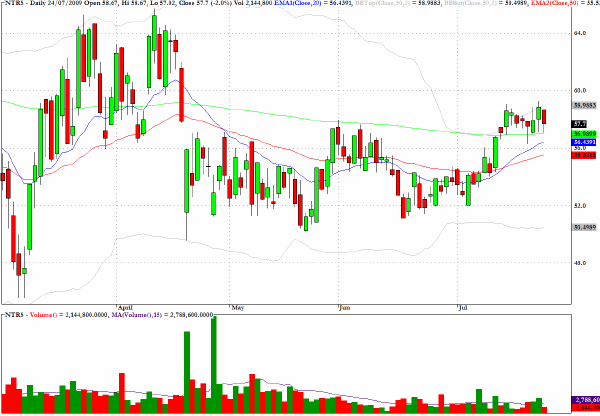
Northern Trust (NTRS) managed to find support above all three moving averages in Friday’s low-volume session, and an attractive reward/risk ratio presents itself with a possible intermediate term target of $64.

Clive Corcoran is the publisher of TradeWithForm.com, which provides daily analysis and commentary on the US stock market.
|