| Corcoran Technical Trading Patterns For July 28 |
| By Clive Corcoran |
Published
07/28/2009
|
Stocks
|
Unrated
|
|
|
|
Corcoran Technical Trading Patterns For July 28
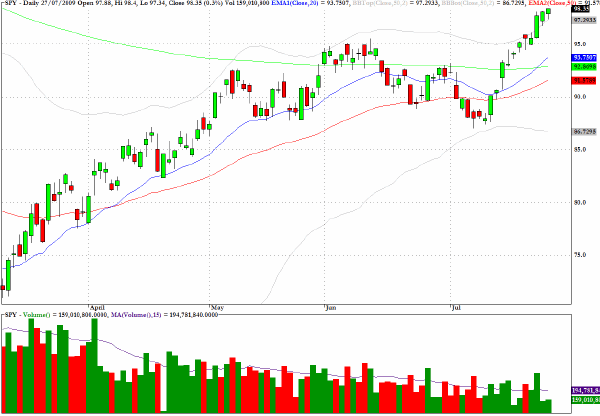
SPY is within two percent of the 100 level which would in essence equate to the 1000 level on the S&P 500 cash index. It has moved up in almost parabolic fashion since early July, and once again yesterday did so on sub-par volume.
The sell-off in early July has eliminated the obvious signs of negative divergences in MACD and MFI that I would be looking for to question the continuation of this rally.
Rather I am focusing more on the forex and fixed income market at present and will be staying away from any plays on the equity indices until it becomes clearer whether those anxious to hit the sell button can prevail before the 1000 level is hit.
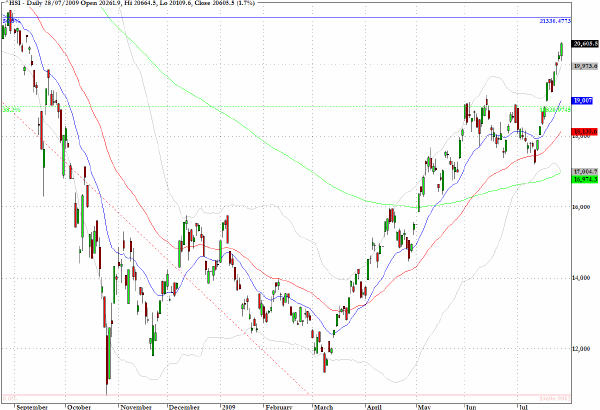
The Hang Seng Index (HSI) is one of the most lively of the easily accessible global indices and, in my opinion is within a couple of days of reaching the 21,300 milestone - equivalent to a 50% retracement of the historic high from October 2007 and the swing low from a year later.
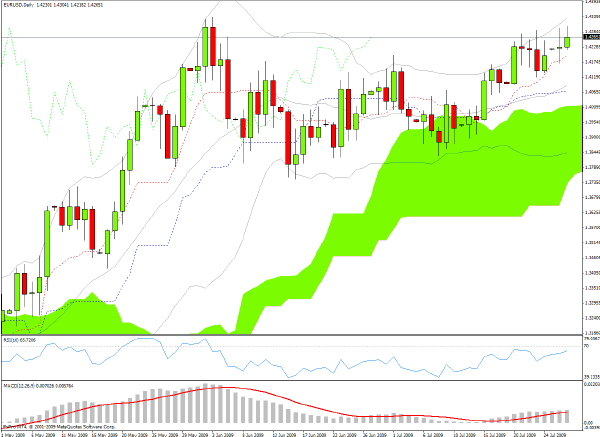
The Euro has made repeated, and so far unsuccessful, attempts to break above the $1.43 level, and traders in Europe on Tuesday morning are once again pushing the currency back for another attempt.
My contention is that this level needs to break in order to validate a move above the 1000 level on the S&P 500, if and when it comes.
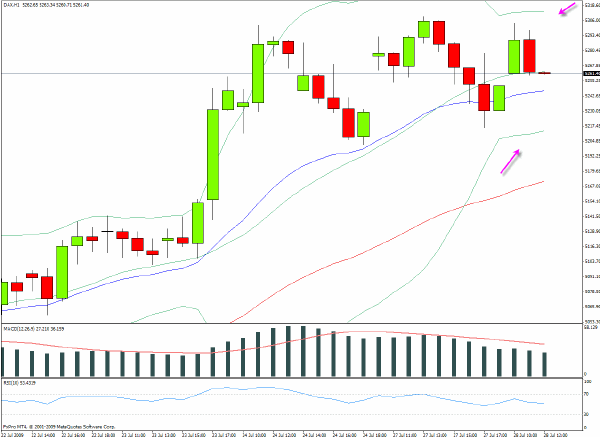
This morning in European trading Germany’s DAX index reveals coiling and constriction of the Bollinger bands on the hourly chart. Along with other key European indices, a pattern is emerging where they to seem to spend most of each morning trading in a holding pattern waiting for directional cues from US data.
The narrowing of the volatility bands suggests that a decisive directional move is imminent.
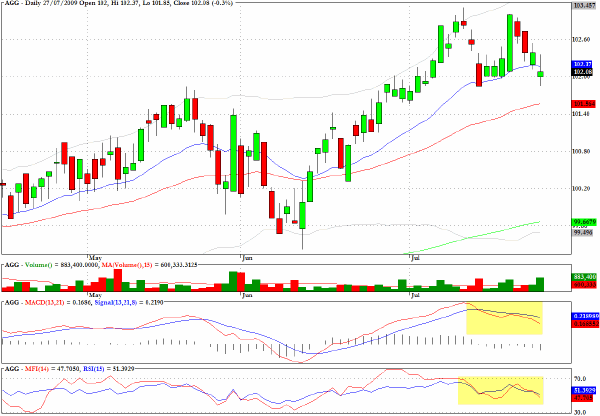
AGG, which tracks the iShares Lehman Aggregate Bond Index, is, unlike most long sector fund charts, starting to display some indications of an approaching correction. The fund SHY which is another fund tracking short-term Treasuries has some similar signs.
The fixed income market will be vital to monitor over the coming days as the questions about the Fed’s exit strategy and the ability to keep funding these massive auctions is still causing unease.
The one element that cannot be forgotten in considering the debt/GDP ratio is the ratio between the expected growth rate of national income (and therefore tax revenues) on the one hand versus the interest rate that will need to be paid out to the capital markets to adequately fund multi-trillion dollar deficits.
This constitutes the wall of worry which, according to present form, seems to be energizing the equity bulls.
The Australian dollar has been benefiting as a commodity currency in the overall thematic of growing risk appetite and renewed optimism about an upturn in global activity.
This comes despite evidence that while global trade is no longer declining at the rates seen last year - indeed it would be hard to sustain falling off a cliff - there is precious little evidence of any vigor in trading and shipping data.
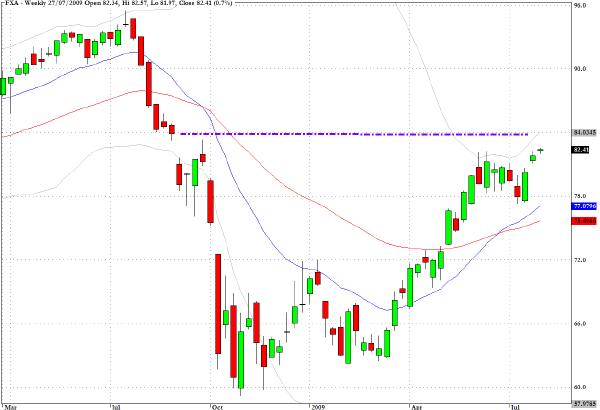
The exchange traded fund FXA reveals that the recovery in the Aussie currency has a significant gap from last fall to confront and the risk/reward on the long side for the commodity currencies in general is beginning to look less attractive in the near term.
Clive Corcoran is the publisher of TradeWithForm.com, which provides daily analysis and commentary on the US stock market.
|