| Corcoran Technical Trading Patterns For July 30 |
| By Clive Corcoran |
Published
07/30/2009
|
Stocks
|
Unrated
|
|
|
|
Corcoran Technical Trading Patterns For July 30
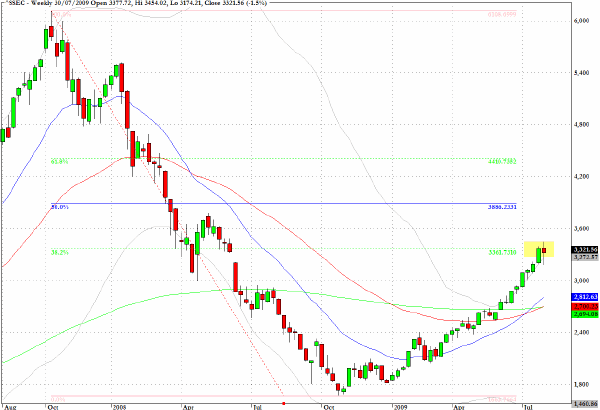
I was travelling yesterday and unable to prepare my commentary; otherwise I would have drawn attention to the rather large drop in Shanghai during Wednesday’s session. Readers may recall that I had featured the chart for the Shanghai exchange in last Friday’s column and indicated that the index had reached the 38% retracement zone from the historic high to last year’s low and where a pause would be expected.
The China bulls will keep stressing all of the positives for the emerging markets, and especially China and India, but there are indications that their governments are beginning to have concerns that bubble-mania is not just a problem that the "advanced" western economies are prone to.
The one fly in the ointment for the global recovery story would be for evidence of the need for some supply dampening in the fast-growing Asian economies. It is becoming more apparent that there is over-capacity in so many areas of the global economy that, while US and European economies attempt to re-group from the debt overhang, it cannot make sense, at the margin, to keep investing in new capacity in certain sectors of the Chinese economy.
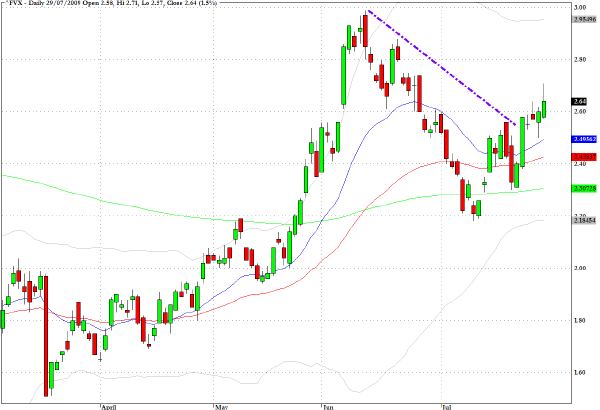
The results of the Treasury auctions so far this week have been disappointing, and some observers of the US public debt market are sensing that the massive supply which still needs to find buyers as the year progresses could cause some disruptions along the way.
Bloomberg has the following story from London action in Treasuries on Thursday morning in anticipation of the auction for 7-year notes in today’s US session.
Treasuries fell, with the yield on the seven-year note approaching the highest level in more than a month before a $28 billion sale of the securities, as stock gains damped demand for the relative safety of government debt.
Ten- and 30-year debt led declines as the MSCI World Index rose for the first time in three days. Today’s auction is the last of four debt offerings this week, totaling $115 billion. Sales in the past two days drew higher yields than expected, signaling demand is waning for the record amount of debt the U.S. is selling this year.
“This week’s auctions have been pretty disappointing,” said Peter Mueller, a fixed-income strategist at Commerzbank AG in Frankfurt. “Bonds will take their direction from what is going on in the equity markets in the coming days. Risk sentiment is still all-important.”
“For the second successive session, the Treasury market was knocked violently out of its stride by a weak auction, with low indirect bids,” said John Wraith, head of sterling-rate product development at RBC Capital Markets in London.
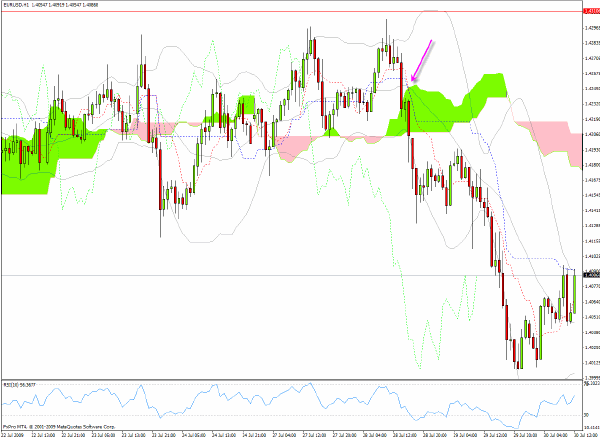
Earlier this week I pointed to the difficulties which the Euro has been having in its efforts to break above the $1.43 level in an effort to reach back to $1.4330 which was registered in early June. As the chart reveals, the successive attempts have all failed in the last several sessions and the currency sold off rather abruptly in yesterday’s session.
The target level of $1.4035 - which is the fibonacci 50% retracement of the June high at $1.4330 and the swing low level at $1.3740 proved to be an excellent point to capture profit following the breakdown. The currency has managed to find support at the $1.40 level and a move back to the pink cloud on the Ichimoku chart below, and this will provide another opportunity to be stalking the sell side of the EUR/USD pair.
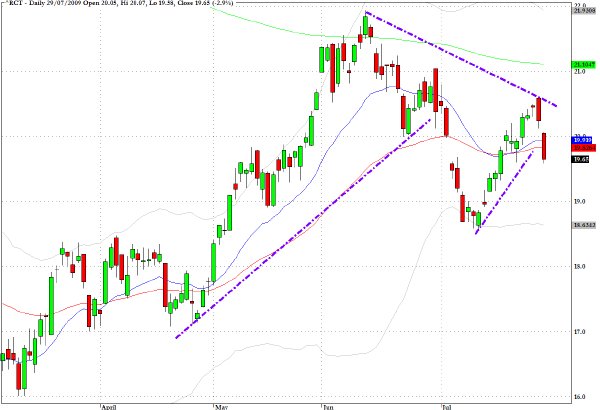
Commodities are extremely sensitive to the China dynamo story and yesterday’s action in the Rogers Commodity Index (RCT) demonstrates how fragile sentiment is at current recovery levels.
One senses that there are a lot of nervous fund managers that would not take much persuading that the reflation trade is over-cooked and that it is better to lighten up on some of the equity-related commodity plays before everyone starts looking for the exits.
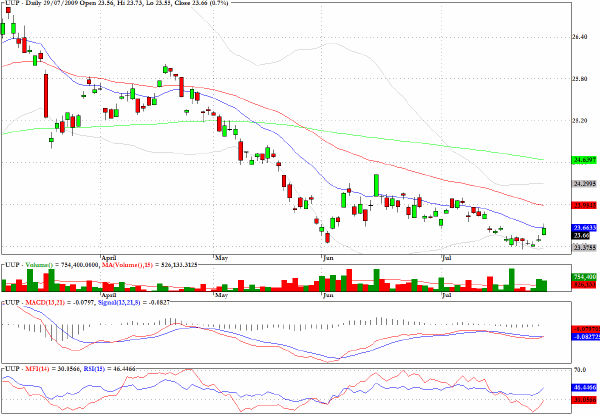
UUP, the ETF which allows one to profit from recovery of the US dollar against a basket of currencies, is still in a basing pattern but if, as I am expecting, the risk aversion factor moves back on to the agenda in coming weeks the reward/risk on this index appears to favor the long side.
My comment on Tuesday regarding FXA which tracks the Australian dollar against the USD proved to be timely.
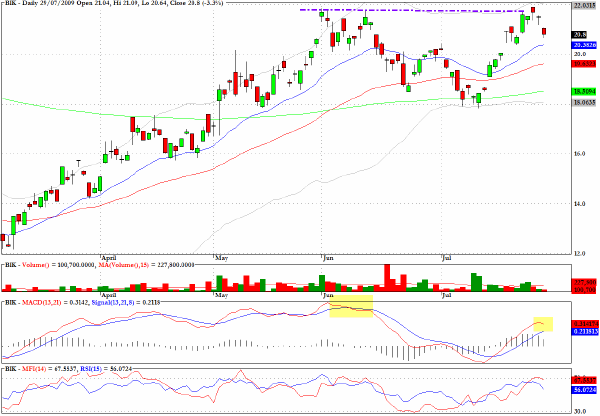
BIK, an exchange traded funds which tracks the BRIC emerging market sector, has some negative divergences in what could validate a double topping pattern.
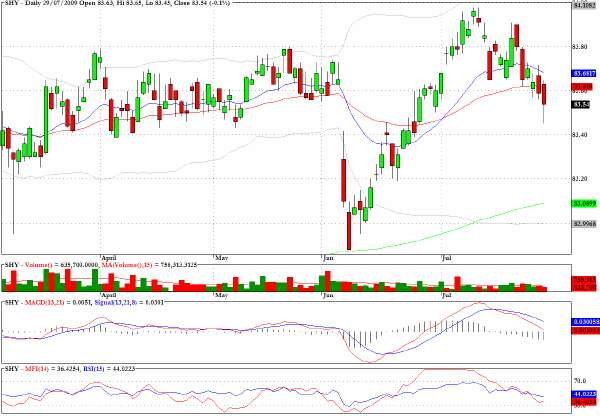
As previously observed, the short end of the Treasury curve is seeing a move up in yields following a rather weak auction in two-year notes earlier this week. The chart below is an ETF which tracks the prices of 1-3 Year Treasuries (SHY), and shows that prices on this sector of the yield spectrum are coming under pressure with the price dropping below the 50-day EMA in yesterday’s session.
Clive Corcoran is the publisher of TradeWithForm.com, which provides daily analysis and commentary on the US stock market.
|