| Corcoran Technical Trading Patterns For July 31 |
| By Clive Corcoran |
Published
07/31/2009
|
Stocks
|
Unrated
|
|
|
|
Corcoran Technical Trading Patterns For July 31
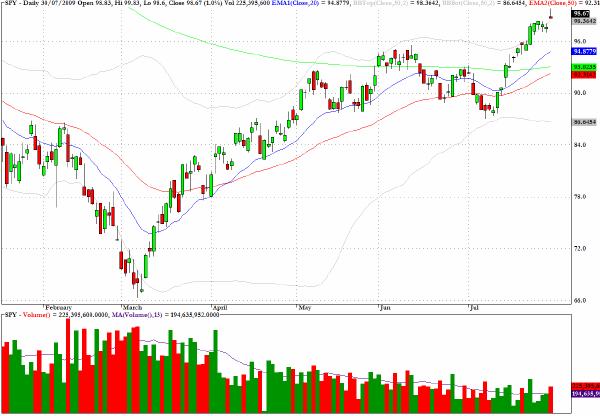
It is starting to feel frothy again. US equities came hurtling out of the gate on the open yesterday and it looked as though 1000 might be achieved in the first hour of trading after market traders saw more rosy news on the global recovery story. The S&P Cash index peaked at about 997 and then the market drifted in anticipation of the results from the 7-year note auction.
Results of the auction were certainly a lot healthier than those seen in Wednesday’s five-year auction, but the devil is in the details and some still have their concerns about the refunding still to come.
After the auction, the market tried to rally again but seemed to lack the dynamism of the first ten minutes of the session.
There is a lot of anticipation of the GDP numbers to be released today and we could be in for some more fun at the beginning of the session. The 1000 level has been a target of mine for some time and I would expect some congestion to arise in this vicinity. Are we moving towards a blow off top? I think so.
But it would not surprise me if there were some more high-wire drama first.
By nature I am an optimist, and even though the Armageddon merchants looked to be in the ascendancy over the last few months, the evidence now is clearly pointing to the fact that having come to the abyss and gone beyond there are many in the markets who think it’s back to business as usual.
The IMF has recently published some sobering news for the realists, however and the BBC News website has captured the "highlights" (if that is an apt description).
The global credit crunch has cost governments more than $10 trillion, the International Monetary Fund (IMF) says.
The IMF says that rich countries have provided $9.2tn in government support for the financial sector, while emerging economies spent $1.6 tn.
Around $1.9tn represents up-front expenditure, while the rest is made up of guarantees and loans.
Governments are likely to recover most of these sums when the world economy recovers, but big deficits will stay.
The financial bail-out costs include:
* Capital injections: $1.1tn
* Purchase of assets: $1.9tn
* Guarantees: $4.6tn
* Liquidity provision: $2.5tn
The IMF estimates - prepared ahead of the G20 summit of world leaders in Pittsburgh in September - also show how much long-term damage the crisis is doing to public finances.
It estimates that by 2014, government debt will reach 239% of GDP in Japan, 132% in Italy, 112% in the US, and 99.7% in the UK.
Proportionately, however, the rise in the UK is the biggest - with debt more than doubling from 44% in 2007.
Rating agencies have recently warned that a UK debt of 100% of GDP would force them to consider downgrading the credit rating of UK government bonds.
This could make it more costly for the government to raise money.
The IMF says that it is important for governments to show a credible path for reducing deficits in the long-run, although it urges them to continue the fiscal stimulus in the short-term.
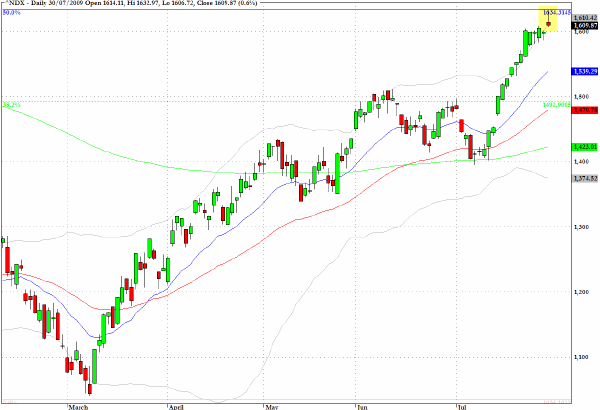
Of all the major indices yesterday the one which registered the most striking shooting star candlestick was that for the Nasdaq 100 index (NDX).
On the chart below I have indicated the 50% retracement level from the multi-year highest close at 2238.98 on the last trading day of October 2007 and the lowest close from November 20, 2007 at 1035. The exact level for the fib 50 retracement is at 1633 which was more or less tagged as the intraday high yesterday.
We could steam through this without hesitation, but even the most ardent believers of the V shaped recovery may be getting just a little breathless. Things may be a little clearer by the end of today’s session.
The next target for the bulls would be the 61.8% fib level which is at 1774. It is unlikely that we could get there today - but perhaps that’s the number that the algorithms have been told to target!
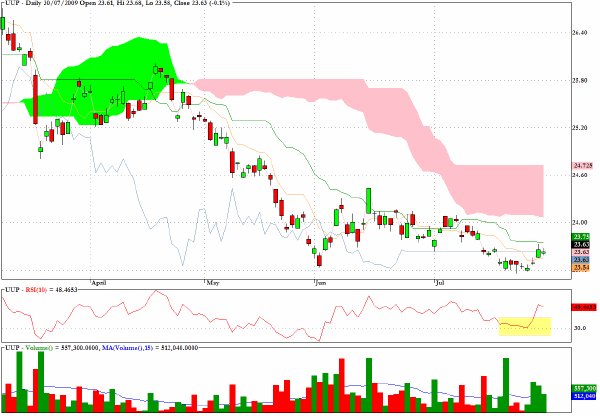
I shall repeat my call from yesterday that the US Dollar index looks to be basing and could be preparing for a decisive move upwards.
Yesterday’s inside day on the UUP chart, as well as an Ichimoku crossover and the momentum dynamics, suggest that the long side is the right place to be on this sector fund.
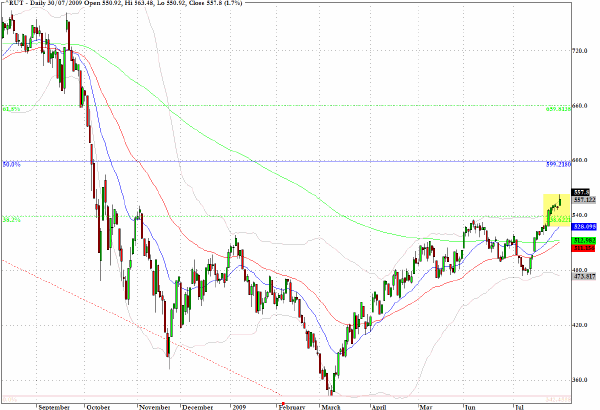
The Russell 2000 (RUT) index went into the early July doldrums more rapidly than the larger cap indices but now is mounting a heroic charge in the vanguard of the current advance.
For a bullish continuation play the target on the chart below for the equivalent 50% retracement move to that discussed for the Nasdaq 100 is 600.
It is worth reminding ourselves that the Russell 2000 has a higher beta than the S&P 500 or even the Nasdaq 100 which means it will outperform when markets get racy and underperform when they slump.
I would not advocate shorting this current rally as there are some unusual dynamics at work at present and machines may not suffer from vertigo in the same way that human traders might begin to contemplate after the recent parabolic rise.
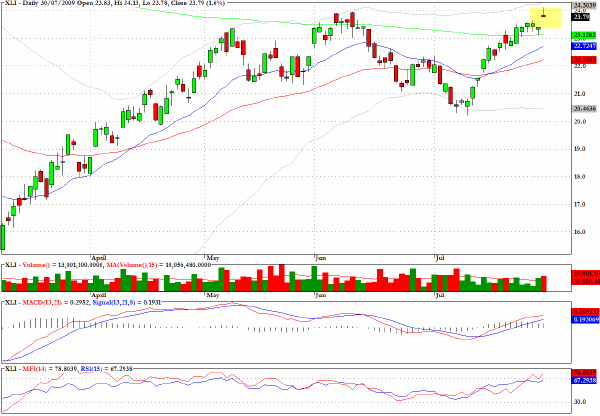
Among those sector funds that I would have on the radar for eventual short plays would be XLI, which is a sector fund for the industrials.
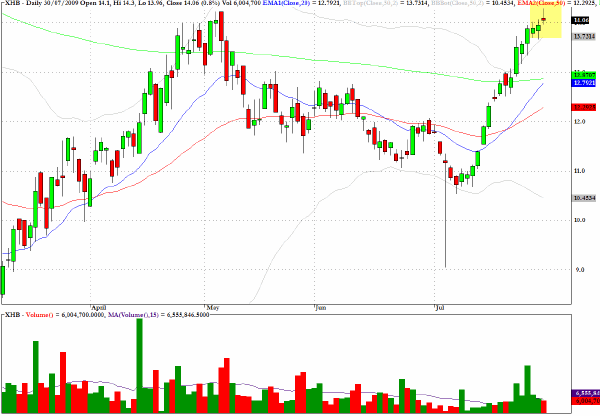
XHB, an exchange traded fund which tracks the homebuilding sector, also appears to have discounted the housing recovery story such as it is. Just how much more good news is there to keep moving this higher?
Clive Corcoran is the publisher of TradeWithForm.com, which provides daily analysis and commentary on the US stock market.
|