| The McMillan Options Strategist Weekly |
| By Lawrence G. McMillan |
Published
07/31/2009
|
Options
|
Unrated
|
|
|
|
The McMillan Options Strategist Weekly
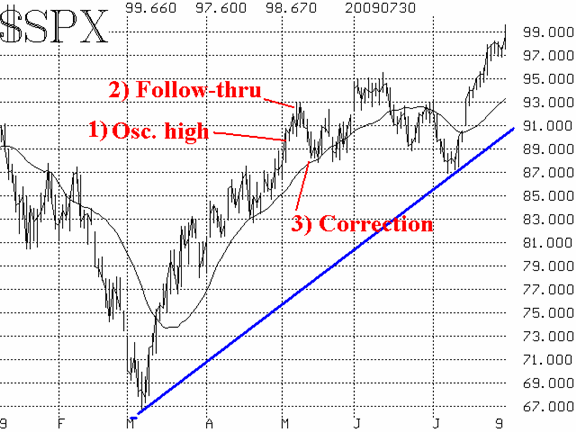
The breakout rally, started when $SPX broke out over 950 -- and thus out of its trading range -- continues to be strong. The $SPX chart is positive in that there is a clear uptrend line now, and the moving averages are rising (see Figure 1). Having said that, there are several indications that this market is severely overbought. One is that $SPX has now risen above its 3-standard deviation Bollinger Band, something that rarely happens.

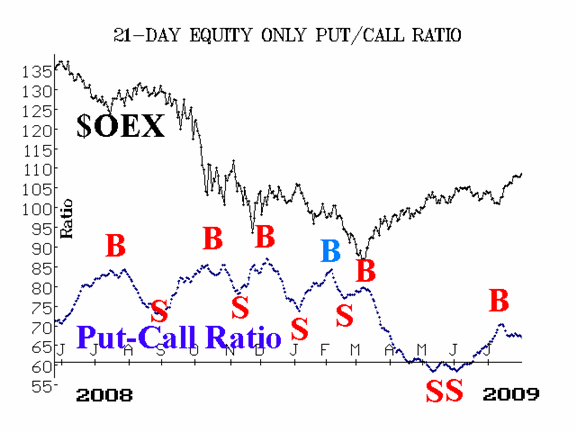
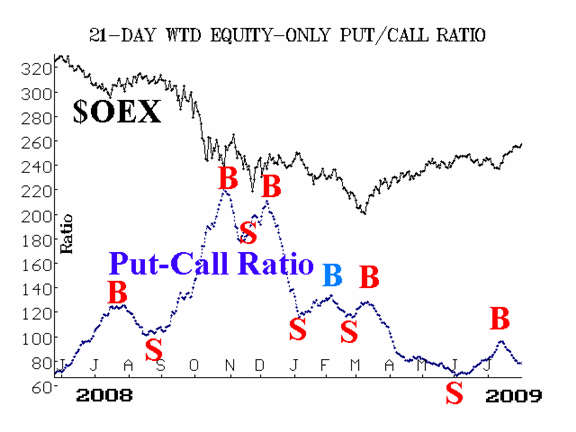
The equity-only put-call ratios remain on buy signals. The standard ratio had wavered a bit this week, but the computer program that we use to analyze these charts had resolutely stayed bullish, and now both ratios are making new relative lows again. These ratios are not overbought, as they are not that low on their charts. What is overbought, though, is market breadth.

Market breadth has been extremely strong, and is overbought at a result. Normally, strong breadth on a bullish breakout is a very positive thing, and that appears to be true again this time.

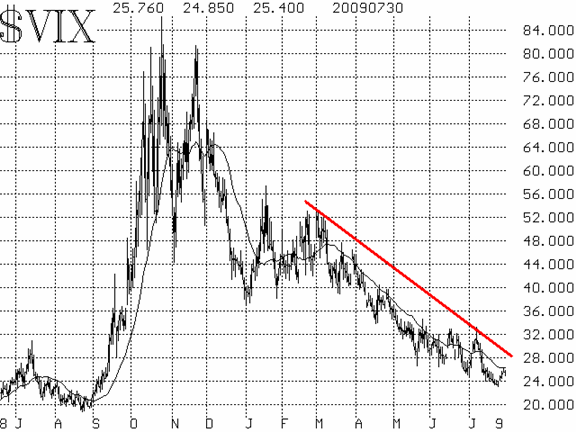
The volatility indices ($VIX and $VXO) moved higher this week. It is quite unusual to see $VIX rise at the same time that $SPX is rising. In a broader sense, $VIX is still in a downtrend, and that is bullish for the broad market.

In summary, the market is bullish but overbought. We would expect a correction of 50 $SPX points or so to begin soon, to alleviate this overbought condition, thus paving the way for higher prices.
Lawrence G. McMillan is the author of two best selling books on options, including Options as a Strategic Investment, recognized as essential resources for any serious option trader's library.
|