| Corcoran Technical Trading Patterns For August 3 |
| By Clive Corcoran |
Published
08/2/2009
|
Stocks
|
Unrated
|
|
|
|
Corcoran Technical Trading Patterns For August 3
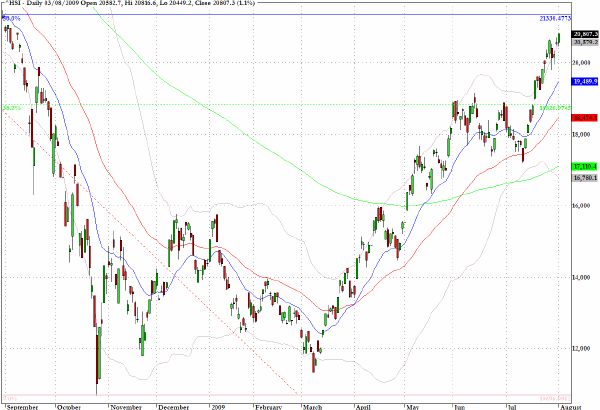
Despite a muted reaction to the GDP figures released last Friday from European markets that afternoon and the lethargy continued into the North American close, the Asian markets, and in particular Hong Kong and Shanghai, always seem to find the silver lining to every cloud. In Asian trading on Monday, both markets continued to march higher although the Nikkei appears somewhat stalled after crossing the 10,000 barrier.
As I have previously suggested, the near-term target for the Hang Seng Index (HSI) is the 21,300 level which represents the 62% retracement of the historic high and last fall’s low.
I would expect this level to be touched before Friday of this week.
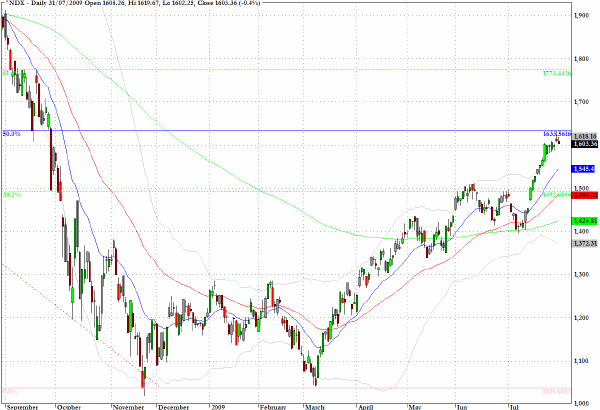
On the chart below I have indicated the 50% retracement level from the multi-year highest close at 2238.98 on the last trading day of October 2007 and the lowest close from November 20, 2007 at 1035. The exact level for the fib 50 retracement is at 1633 which was more or less tagged as the intraday high yesterday.
We could steam through this without hesitation but even the most ardent believers of the V-shaped recovery may be getting just a little breathless.
These were my comments from last Friday and there is little to add to them.
The US dollar index has confounded me and several other analysts, it seems, by continuing to erode. The UUP suggestion from last Friday was not well timed and one has to remain skeptical that global traders are showing much interest in the greenback at present.
Risk aversion seems far less to be an issue as the V shape takes form on all kinds of adventurous markets that in early 2009 one could not get arrested in.
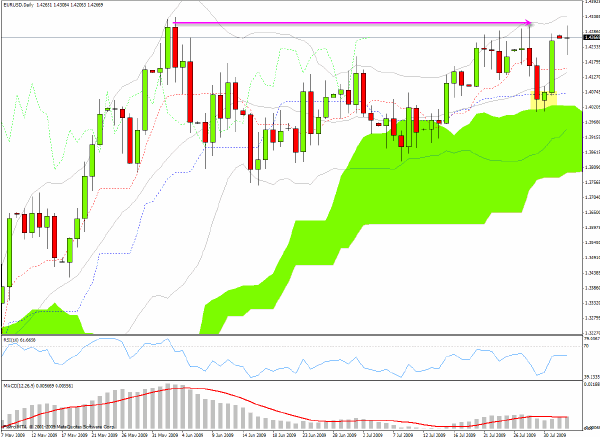
As this is being written, the euro, which along with other currencies performed a major reversal during Friday’ session after the GDP numbers were released, is once again knocking on the $1.43 door. The daily chart of the EUR/USD in Ichimoku mode shown below highlights the manner in which the top of the green cloud provided the exact support level last week after the currency came under fire in the earlier part of the week.
To somewhat paraphrase the remarks of another analyst, USA Inc is trading like a commodity on the screens of macro hedge fund traders.
Good news (if in fact that’s what the GDP numbers were --?) for the US economy is used as an excuse to pile into commodities, emerging markets and sell the dollar.
It is beginning to feel just a little too well regimented from my perspective.
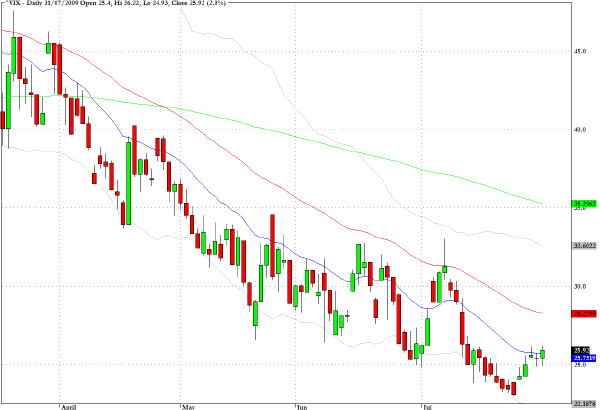
The VIX has experienced a couple of minor upward moves recently and as I watched the screens on Friday evening in London (sad, I know, but there were a couple of quick trades to monitor) there was a fairly noticeable jump in the VIX as the S&P 500 closed on a rather sour note for the session.
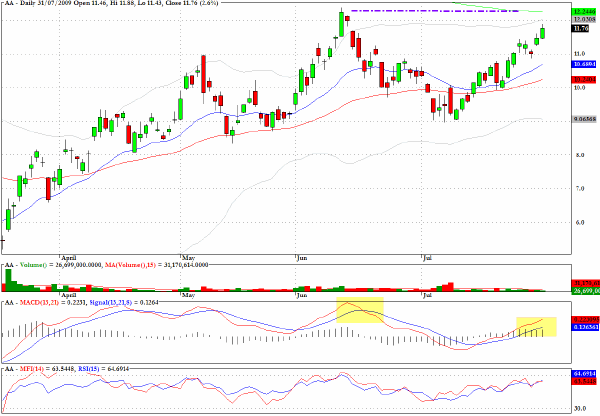
Alcoa (AA) is coming back towards a possible double top formation with overhead resistance from the 200-day EMA to contend with as well.
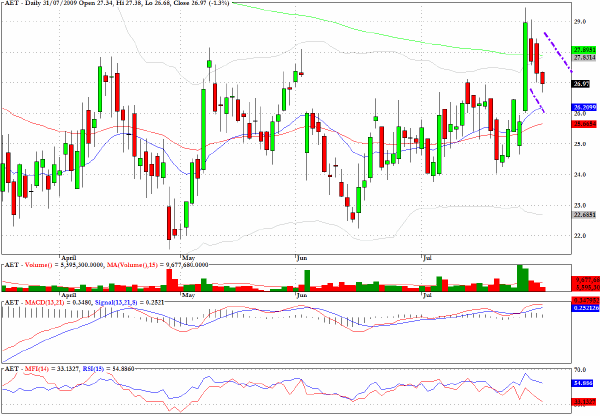
Aetna (AET) has a bull flag formation with entry possibilities nearer to the $26 level possibly today.
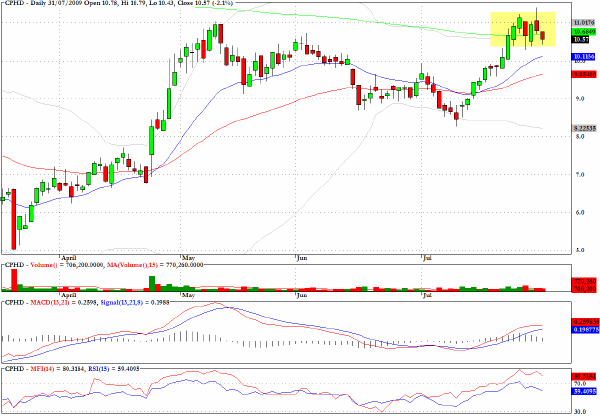
The chart for Cepheid (CPHD) has similar concerns to those expressed for Alcoa.
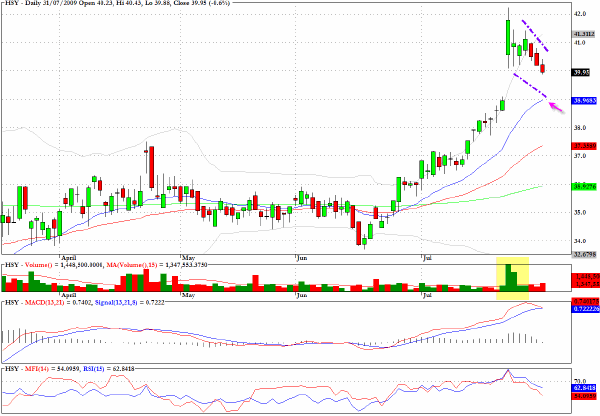
Hershey Foods (HSY) also has a clearly defined bullish flag formation and entry possibilities could be on the radar in the next couple of sessions.
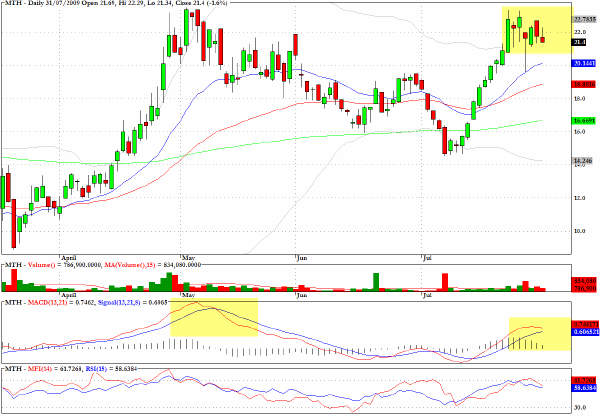
Meritage Homes (MTH) among the homebuilders may still have some energy to further push higher but the negative momentum characteristics would have me preferring to stalk out a possibility for the short side rather than to continue in a low reward/risk scenario on the long side.
Clive Corcoran is the publisher of TradeWithForm.com, which provides daily analysis and commentary on the US stock market.
|