|
The Wagner Daily ETF Report For August 3
Stocks capped a very strong month with a lackluster session of trading last Friday. After chopping around in a tight, sideways range throughout the entire day, the major indices closed near the flat line and with mixed results. The Dow Jones Industrial Average advanced 0.2%, the S&P 500 eked out a gain of 0.1%, and the Nasdaq Composite slipped 0.3%. The small-cap Russell 2000 lost 0.1%, while the S&P Midcap 400 was higher by the same percentage. The S&P 500 and Dow Jones Industrials settled just below the middle of their intraday ranges, but the Nasdaq finished near its lowest level of the day.
Like last Friday's broad market price performance, turnover was mixed as well. Total volume in the NYSE was 11% higher than the previous day's level, though volume in the Nasdaq receded 13%. The 0.1% gain in the S&P 500 was not large enough to qualify the session as a bullish "accumulation day." However, it's positive that lighter volume in the Nasdaq enabled the exchange to avert a bearish "distribution day." In the NYSE, advancing volume exceeded declining volume by just under 3 to 2. The Nasdaq adv/dec volume ratio was negative by nearly the same margin.
In last Friday's (July 31) morning commentary, when discussing the potential of a failed breakout from the July 30 session, we suggested focusing on ETFs with low overall correlation to the direction of the stock market. As if on cue, commodity, currency, and fixed-income ETFs, each with a low correlation to the main stock market indexes, surged higher in that day's session. This validated our initial analysis, and positions those sectors for further gains in the coming week.
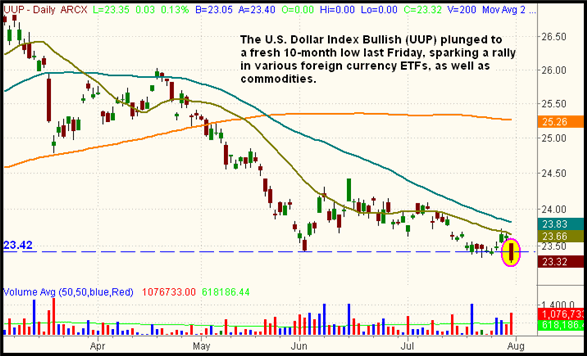
Perhaps the biggest driving force behind the solid gains in commodity, currency, and fixed-income ETFs was the plunge of the U.S. dollar to a fresh 10-month closing low last Friday. This is shown on the daily chart of PowerShares U.S. Dollar Bull (UUP), a popular ETF proxy for the general health of the U.S. dollar (compared to a basket of six different currencies):

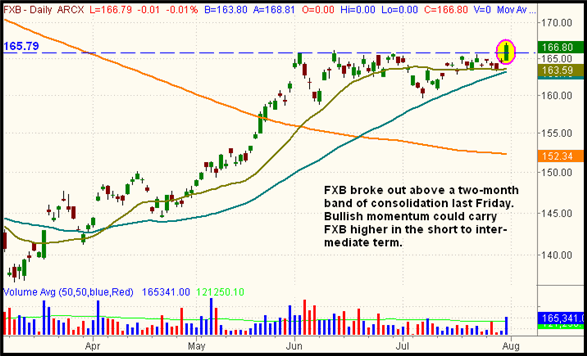
The breakdown in the U.S. dollar caused our setup in CurrencyShares British Pound (FXB) to trigger for buy entry, after it moved above key resistance of a two-month band of consolidation. Greater than average volume helped confirm the move. The breakout in FXB is shown on the daily chart below:

In addition to FXB, other currency ETFs to consider are Canadian Dollar (FXC), Australian Dollar (FXA), and the inversely correlated PowerShares U.S. Dollar Bearish (UDN). Each of those three currency ETFs broke out above resistance to new recent highs last Friday. The Euro (FXE), conversely, is still consolidating below resistance of its June and July highs. The Japanese Yen (FXY), which we're also long, has lost its relative strength since our July 20 entry. However, the ETF is at major support of its 20, 50, and 200-day moving averages, and also made a nice gain last Friday.
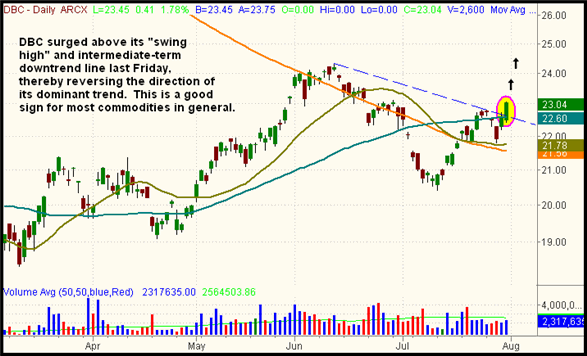
DB Commodity Index (DBC) is reversing the direction of its dominant trend, which is a good sign for the short to intermediate-term direction of commodities in general. Take a look:

Along with DBC, the U.S. Oil Fund (USO) moved back above its 50-day moving average last Friday, and also closed above its prior "swing high." With newfound relative strength, USO is now in the process of reversing the direction of its dominant trend. As analyzed in the July 31 issue of The Wagner Daily, USO is now poised for a quick rally to test resistance of its June high. U.S. Gasoline Fund (UGA) is showing even more relative strength than USO, but is now a bit extended past its breakout level. After tricky, mid-week "shakeouts" last week, Gold (GLD) and Silver (SLV) are now poised for further strength as well. We're already positioned in Gold Double Long (DGP), which we bought on July 23.
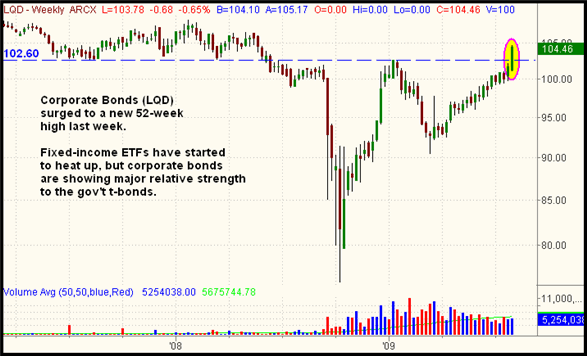
All of the fixed-income government T-bond ETFs moved higher last Friday, but iShares Corporate Bonds (LQD) continues to show bullish divergence to the various T-bond ETFs. On the weekly chart below, notice how LQD surged above a major level of horizontal price resistance last week. The ETF Portfolio Tracker, a longer-term sister newsletter to this one, has been positioned in LQD since June 15:

In addition to the ETFs with low correlation, there's still a list of industry sector and international ETFs we're stalking for pullbacks or corrections by time. These include tickers such as IBB, SMH, EWP, and TUR. We'll keep an eye on our pullback watchlist in the coming week, and will update you if we see any entries we like.
Open ETF positions:
Long - DGP, FXB, FXY
Short - (none)
Deron Wagner is the Founder and Head Trader of both Morpheus Capital LP, a U.S. hedge fund, and MorpheusTrading.com, a trader education firm.
|