| Corcoran Technical Trading Patterns For August 10 |
| By Clive Corcoran |
Published
08/10/2009
|
Stocks
|
Unrated
|
|
|
|
Corcoran Technical Trading Patterns For August 10
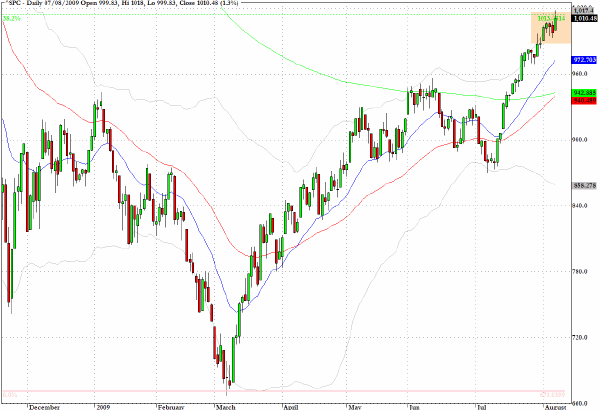
The S&P 500 Cash index has entered a zone of potential resistance (yes, yet another one) as after Friday’s celebratory mood from a better than expected non-farms payroll report, the index is staring at the 38% retracement from the historic top and last March’s low.
Several other indices, both in the US and elsewhere are in the vicinity of some major fibonacci retracements (not all are at the 38% level - although interestingly the Shanghai index appears to have stalled at this level) and one would expect there to be some consolidation.
Earlier in January of this year, I did claim that the S&P 500 would see both 680 and 1000 during 2009 and having got that bit right (well it did actually see 666 but my crystal ball was just a teeny bit hazy that day) I should confess that I am still rather in awe of the most recent rally and would not want to put a lid on it for now.
Cynics of my acquaintance have said that it surely must go on to 1060 or thereabouts as that is the Goldman forecast. So let’s keep an eye on whether we will pause at the 38% fib level or just surge on through. If we do surge on through the correction when it comes could be quite vicious.
Also remember that August is notorious for producing surprises which "no-one saw coming."
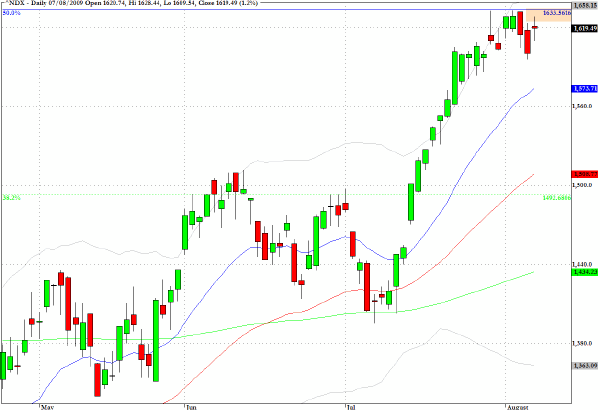
The Nasdaq 100 (NDX) is definitely the hero in the current market but it also has approached a key fib level.
The 50% retracement of the historic high and more recent low is identified on the chart below and the candlestick pattern looks a bit less bullish than the one on some indices - such as the KBW Banking index and the Housing index (HGX).
Trading last Friday’s market in equities following the release of the employment data, about which many pundits could not contain their outright euphoria, was a relatively uncomplicated affair and many would have taken some decent profits out of the market.
In some ways though the easier money was to be made in the forex arena with some very strong and decisive moves downwards by key crosses against the US dollar.
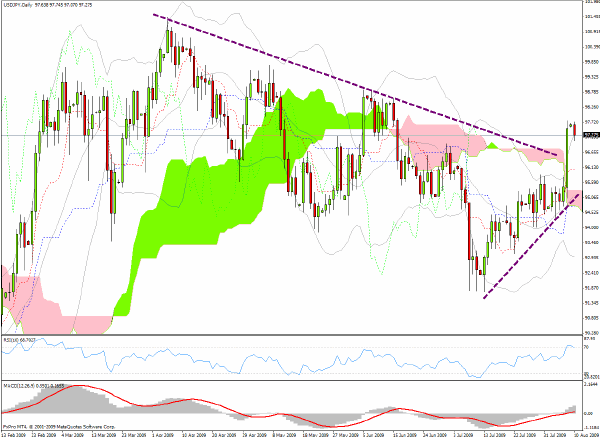
In particular the dollar is moving very bullishly against the Japanese yen and the chart below indicates that the move is well supported from a technical point of view by the current Ichimoku configuration and a wedge pattern which appears to have been violated.
Potentially the yen could move down to the 100 level in coming sessions.
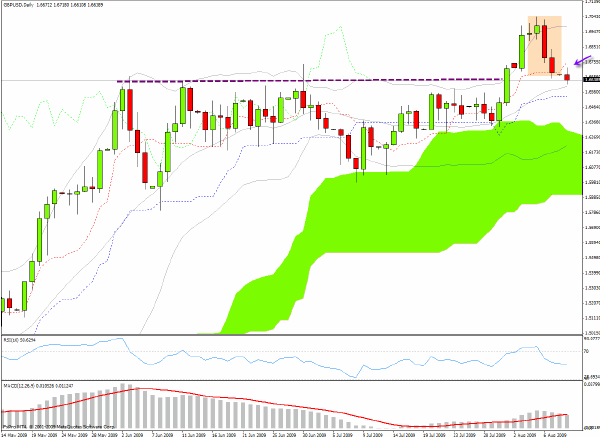
Sterling is in an interesting position as can be seen from the daily Ichimoku chart. After breaking above a major resistance level earlier in the week, last Thursday the pound got clobbered when the Bank of England took the surprising step of adding £50 billion to its QE ceiling.
The currency sold off abruptly as can be seen and in trading in Europe on Monday the currency, along with the euro is still under some pressure.
Until there is a clear Ichimoku sell signal I will hesitate from taking a short position trade but would rather be looking for some intraday scalping moves which could easily generate 150 pips in both directions.
As I did not publish my Daily Form commentary at the end of last week, I thought I would draw attention to the following piece which expresses my views on how the Bank of England appears to be "cornering" the UK government bond market.
The key question is - does anyone want to buy gilts other than the Bank of England?
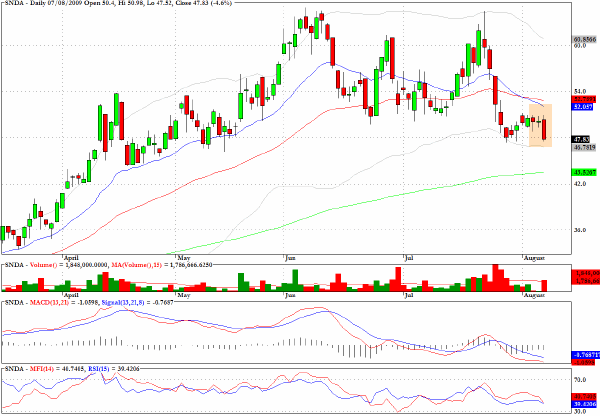
In my last newsletter I mentioned that Shanda Interactive (SNDA) looked vulnerable and the bearish flag pattern proved to have value yet again.
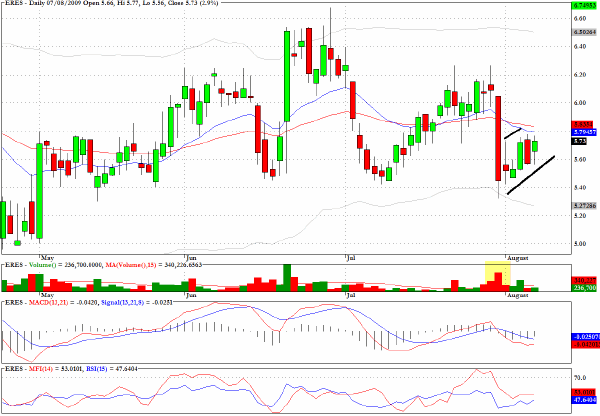
eResearch Technology (ERES) is close to two moving averages at the top of a bearish pullback pattern.
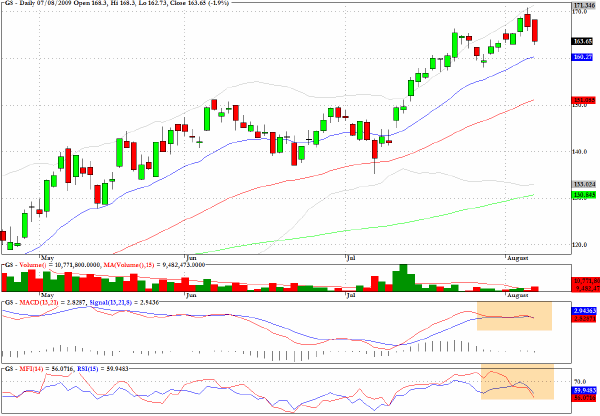
Goldman Sachs (GS) is showing a flattening of the momentum pattern which has propelled it to the $170 level.
GS is never an easy stock to recommend on the short side and rather I would suggest it is worth watching this week for clues as to how the omniscient trading firm sees the world right now.
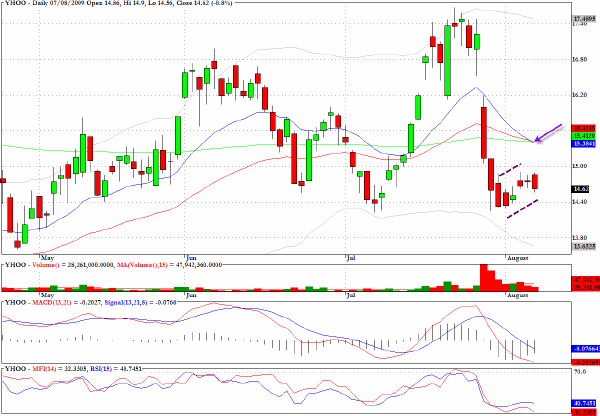
Yahoo (YHOO) looks very vulnerable if it makes its way back towards $15 - but that could take some time and is suggested more as a candidate for this week’s Watch List.
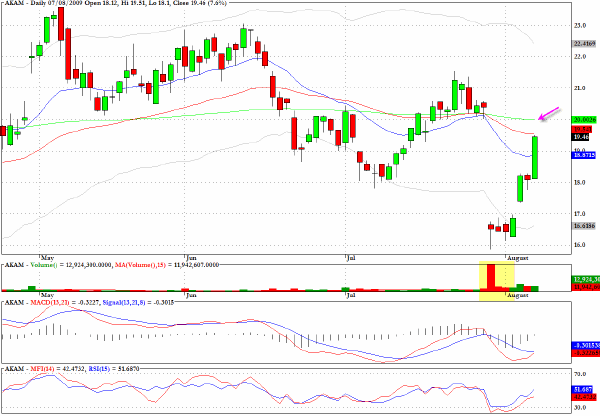
Akamai Technologies (AKAM) also has the right set up for a short sale near to $20.
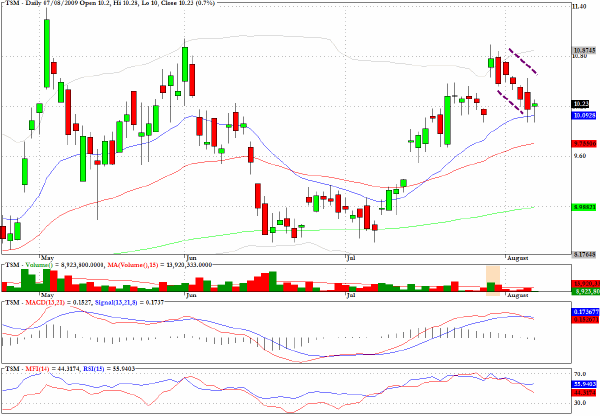
Taiwan Semi (TSM) has a nice bullish flag pattern and could be headed for a re-test of the early May level near $11.40
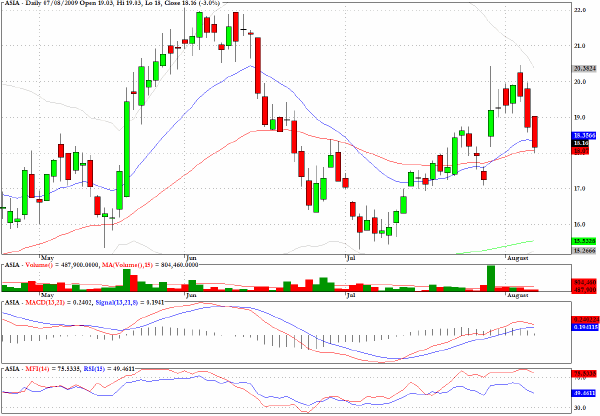
AsiaInfo (ASIA) has a slightly unorthodox bullish flag pattern but has pulled back to a clear support level.
It should be approached with some caution.
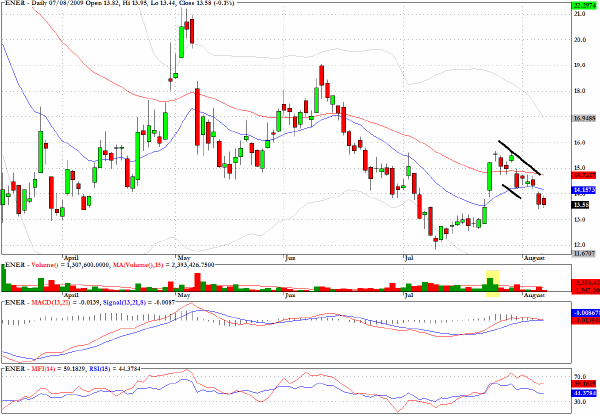
Energy Conversion Devices (ENER), mentioned here last week, still has a technically compliant bullish flag formation, but it should make its move soon or be discarded.
Clive Corcoran is the publisher of TradeWithForm.com, which provides daily analysis and commentary on the US stock market.
|