Regular readers will remember that we've been following the U.S. dollar's recovery from a distance for a while. In a nutshell, we've been generally bullish on the sawbuck (long-term) since early/mid 2005, when the charts made some breaks past some very long-term lines. During that period, many pundits argued that the dollar was still poised for weakness, and should resume its even longer-term downtrend. Fortunately for us, we watch charts more than we listen to other experts, because the dollar has indeed stayed on its bullish trek.
As usual, we'll be comparing the dollar to the yen, and the euro to the dollar. The two charts have pretty much mirrored each other for months, but recently, we're seeing a few distinct (and important) differences. We'll start with the dollar/yen chart, then we'll go on to the euro/dollar chart.
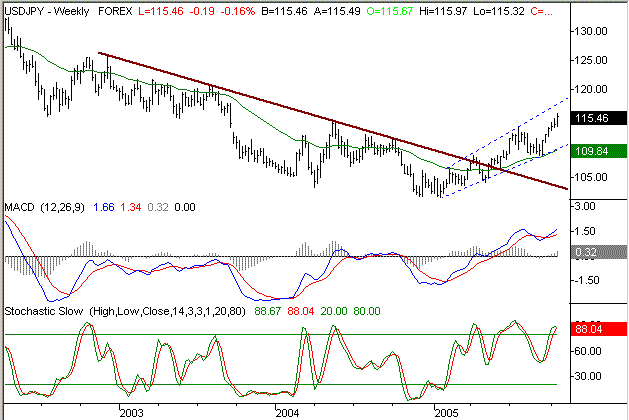
We've redrawn the resistance line (upper dashed line) on this chart to reflect the late-July peak of 113.71. The current exchange rate of 115.44 is still a little under that extended line, but we're still seeing some pressures weigh-in following the run from 109 to 115. That's a pretty big rally for currency, and it will be tough for the market to pass those profits up. Plus, we're stochastically overbought here. So, in the near-term, we don't think the dollar/yen has much gas left. We anticipate a pullback - maybe to 111/112 area.
However, there's very little doubt now that the dollar/yen is in recovery mode. The current price of 115.44 represents a new 52-week high, with the dollar managing to move above last year's peak of 114.89. It's doubtful that we'll move in a straight line, but there is now clear pattern of higher highs and higher lows. That's bullish, and complimented by the fact that we now have a new bullish MACD crossover. As you can see, that's been an excellent longer-term indicator here.
U.S. Dollar Vs. Yen - Weekly

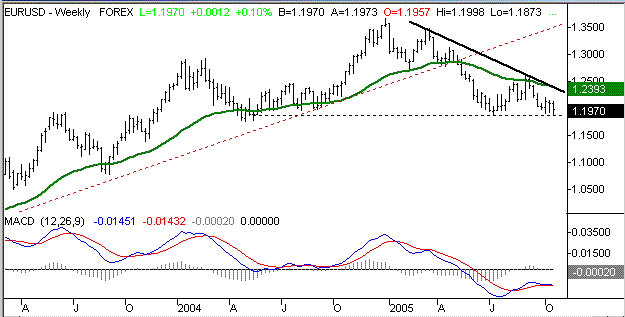
The euro/dollar exchange rate, however, has apparently hit a wall. Remember, this chart may look upside down relative to the dollar/yen chart, but that's only because we're comparing the euro to the dollar (as opposed to the dollar against the euro). The data and premise is still the same.
For some reason, the euro/dollar is hitting a floor around 1.187. That was last week's low, and July's low, and even near where the low was from mid-2004 (see the horizontal dashed line). This chart has made lower highs after topping out in late 2004, so we view the trend as a bearish one for the euro. However, until (and unless) we see this chart finally move under 1.18, the opportunity here may be limited. We think that will ultimately happen, but as usual, timing is the key.
Euro vs. Dollar - Weekly

The bottom line is fairly basic - the chart says the long-term dollar is recovering, and we tend to agree. It just takes a while for this chart to move in what appears to be a significant way. On the other hand, for FOREX traders, a small move here is a huge move for their trading portfolios. The leverage can be 100-to-1 in currency trading, so they don't really need a big move.
Price Headley is the founder and chief analyst of BigTrends.com.