| The Wagner Daily ETF Report For August 11 |
| By Deron Wagner |
Published
08/10/2009
|
Stocks
|
Unrated
|
|
|
|
The Wagner Daily ETF Report For August 11
Stocks kicked off the week on a slightly negative note, as the major indices registered a round of broad-based losses on lower volume. The major indices opened a bit lower, trended down into the afternoon, then bounced off their lows in the final ninety minutes of trading. The S&P 500 and Dow Jones Industrial Average logged matching losses of 0.3%, as the Nasdaq Composite dipped 0.4%. The small-cap Russell 2000 and S&P Midcap 400 indices declined 0.1% and 0.7% respectively. All the main stock market indexes settled just above the middle of their intraday ranges.
Unlike several losing days last week, turnover backed off this time. Total volume in the NYSE receded 25%, while volume in the Nasdaq was 20% lighter than the previous day's level. In both exchanges, volume also slid back below 50-day average levels. The sharply slower trade that accompanied yesterday's losses was positive, as it tells us institutions were not running towards the exit door. Rather, the bulls were merely taking a rest. In both the NYSE and Nasdaq, advancing volume slightly exceeded declining volume. Despite the small losses of the S&P and Nasdaq, market internals remained marginally positive.
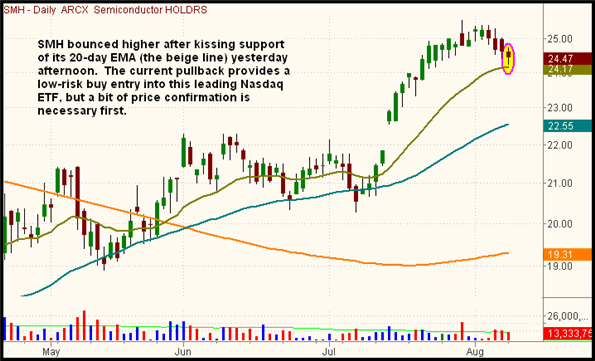
Last week, we began to see institutional sector rotation out of Nasdaq-dominated sectors such as biotech and technology, and into sectors such as banks and real estate. This caused the Nasdaq to drift lower, while the S&P and Dow moved sideways to higher. But now that the charts of several leading Nasdaq ETFs have come into support of their 20-day exponential moving averages (EMAs), we feel there's a good chance the Nasdaq will start to perk up again, relatively speaking. Most notably, the Semiconductor HOLDR (SMH) bounced off its intraday low yesterday, after kissing support of its 20-day EMA. This is shown on the daily chart below:

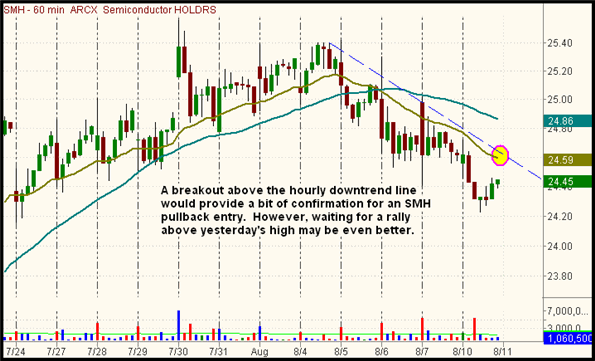
Since breaking out in mid-July, we've been patiently waiting for SMH to come into support of its 20-day EMA, and it has finally done so. Next, we drill down to the shorter-term hourly chart, in order to look for the price level that confirms the intermediate-term uptrend is ready to resume. Specifically, we wait for a breakout above the short-term downtrend line that has developed. Shown on the hourly chart below, notice how a breakout above the week-long downtrend line basically correlates to a rally above yesterday's high:

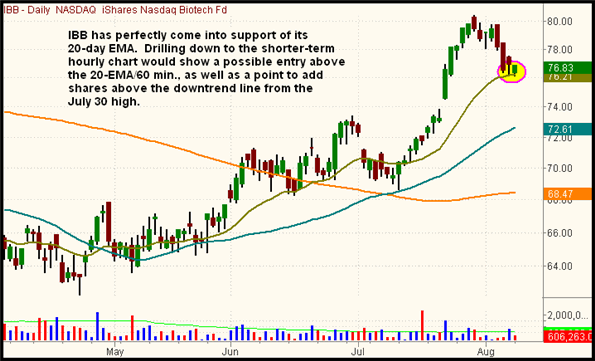
The other Nasdaq ETF we've been stalking for pullback buy entry is iShares Nasdaq Biotech (IBB), which initially came into support of its 20-day EMA late last week. On the daily chart below, notice how the 20-day EMA has perfectly acted as support during its short-term retracement off the high:

If we were to look at the short-term hourly chart of IBB, we see an entry point is not as clear as with SMH. This is because there are actually two different short-term downtrend lines that have developed since the recent highs. The first, which began with the July 30 high, currently shows resistance just below the $79 level. However, a rally above yesterday's high of $76.88 would put IBB back above its 20-EMA on the hourly chart, which would most likely send IBB up to test resistance around $79 pretty quickly. For a setup such as this, one might consider scaling into the position by buying a partial position above the 20-EMA on the hourly chart, and adding the remaining shares above the downtrend line off the July 30 high (above $79). Regular subscribers will see our detailed trigger, stop, and target prices for both SMH and IBB setups below.
This Wednesday afternoon, the Fed will announce its latest comments on economic policy and interest rates. Yesterday's volume was probably slow because many traders and investors are taking the usual "wait and see" approach ahead of the Fed meeting. As such, expect trading to be relatively slow in today's session as well. Unfortunately, it may be tricky to enter new positions ahead of Wednesday's Fed meeting, but we'll be carefully micromanaging any new trades entered between now and then. If the technical setup is solid, we'll take a shot, but only very cautiously, and with one finger poised not too far from the sell button.
Open ETF positions:
Long - DGP, DBO, FXB
Short - (none)
Deron Wagner is the Founder and Head Trader of both Morpheus Capital LP, a U.S. hedge fund, and MorpheusTrading.com, a trader education firm.
|