UUP, the ETF which allows investors to profit from recovery of the US dollar against a basket of currencies, is still in a basing pattern, but Clive Corcoran expects the reward/risk on this index to favor the long side in coming weeks.
The Shanghai market took a tumble in Wednesday’s session in Asia dropping back by 4% and coming to rest almost exactly at the 50-day EMA. For reference sake the 38% retracement level of the historic high and recent low value is shown on the chart.
There would seem to be support at this current level and a pullback pattern may well emerge, but it if reveals the same kind of RSI divergences seen on the bottom chart segment then one has to become more inclined to the view that a significant correction could emerge. 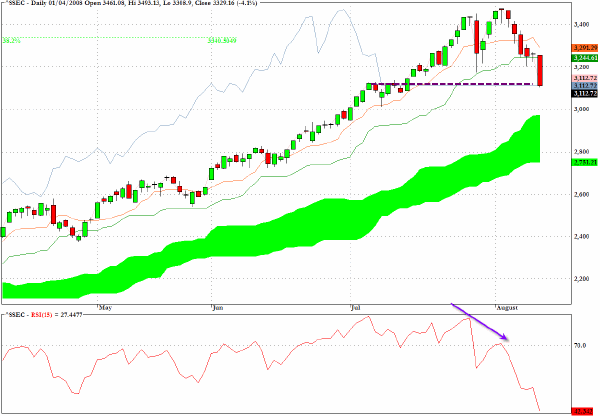
The 30-minute Ichimoku chart of the S&P 500 displays a well-timed sell signal as indicated by the arrow on the chart. 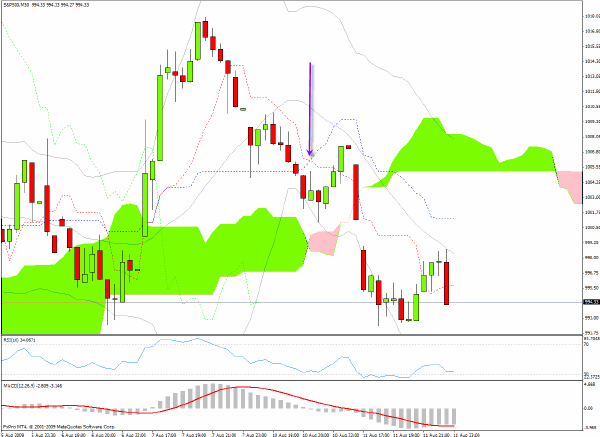
The weekly chart of GBP/USD displays a classic rally failure pattern with the highlighted candlestick pattern being a gravestone doji and, perhaps more remarkably, the drop after the lack of follow through from the peak above the pink cloud.
The forex market is very intriguing at present with many new kinds of divergences and challenges to the correlation patterns which have been establishing themselves over the last several months. Sterling is definitely worth monitoring in the near term for further weakness, but I remain of the opinion which I expressed in Monday’s commentary that until there is a clear sell signal on the daily Ichimoku chart I shall stay focused on intraday moves.
My suspicion is that a sell signal will emerge and when it does there will be substantial room for profits as the economic conditions continue to confound the Bank of England and the UK government. Lord Mandelson, the man who never met a billionaire who he didn’t want to make his immediate best friend, is still spouting forth on Keynesian remedies for public deficits. It’s not necessary to be an absurdist to live in the UK but it does help! 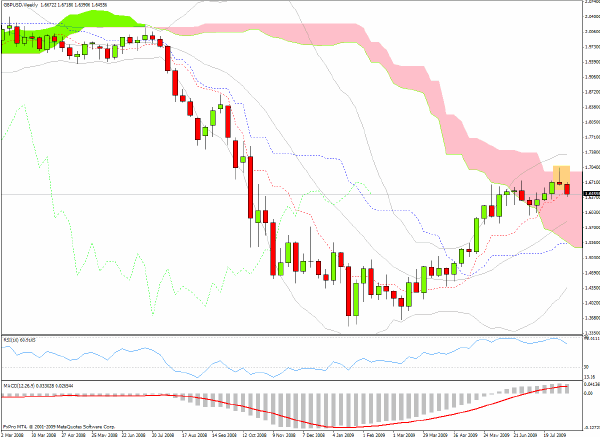
For me, the chart below is one of the more critical to keep an eye on in coming sessions as it tracks a vital cross rate between the Japanese yen and the US dollar. As the price moves up on this pair, the US dollar is gaining strength. There was the break above a clear wedge pattern which I alluded to recently but this now could be a "fake-out" move.
The large hedge funds and bank trading desks are gaming the cross rates with the yen quite keenly at present and it will be interesting to see who prevails.
If the US dollar can break back above the descending line, then I suspect that there could be further dislocations to the correlation framework which has been working so nicely for the automated macro asset allocators who still like to throw the specter of Armageddon into the mix when central bankers and policy makers look confused about the robustness of the financial system. 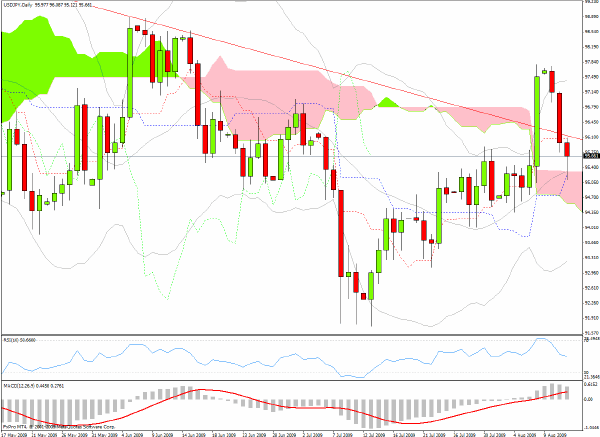
In my newsletter published on July 30 and available in an archive here, I made the following comments about the US dollar, specifically in reference to the bullish play available via UUP.
UUP, the ETF which allows one to profit from recovery of the US dollar against a basket of currencies, is still in a basing pattern but if, as I am expecting, the risk aversion factor moves back on to the agenda in coming weeks the reward/risk on this index appears to favor the long side.
I was early on the call - which is often the case in trying to pick turning points - but the genie for further dollar strength does appear to be out of the bottle. 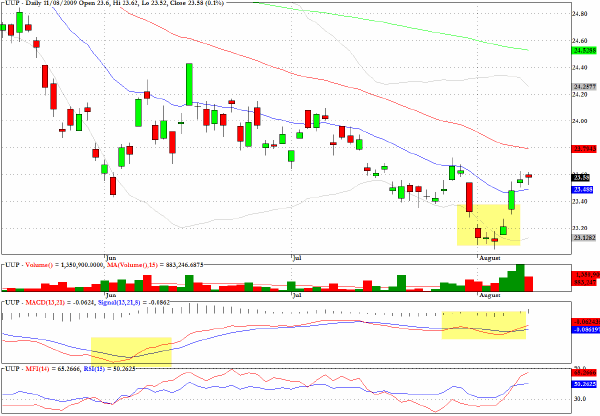
HYG, a sector fund which tracks high-yield debt, could correct in the medium term to the level of support indicated on the chart. 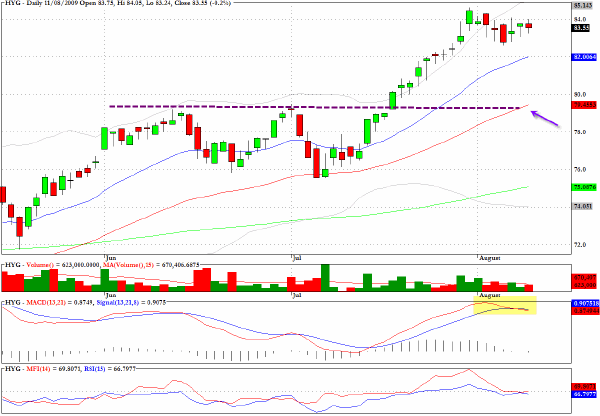
BIK, an exchange traded fund which tracks the BRIC emerging market sector, has been revealing for some negative divergences and increasingly there is case which could validate a double topping pattern. Having said that, the volumes are thin at present and with many looking to buy dips in all kinds of exotic markets, there could be a further wave of ebullience so I suspect that there will be a better time to position oneself for what could be a really nasty sell-off in emerging markets when the larger cap US indices do decide to take their well-earned rest. 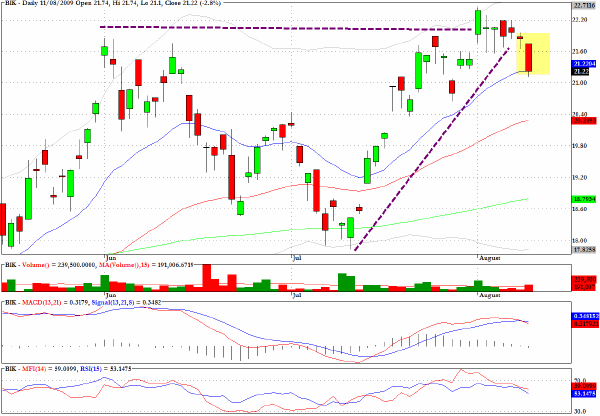
Clive Corcoran is the publisher of TradeWithForm.com, which provides daily analysis and commentary on the US stock market.