| Corcoran Technical Trading Patterns For August 13 |
| By Clive Corcoran |
Published
08/13/2009
|
Stocks
|
Unrated
|
|
|
|
Corcoran Technical Trading Patterns For August 13
I have recently been writing about the Efficient Markets Hypothesis (EMH) for an article and looking at some of the strong criticisms over the years about "chartists" and how there is nothing to be learned from technical analysis as prices move randomly and have already discounted all known information - so what possible benefit could analyzing charts have?
Just how they have discounted all known information and yet still move randomly can be reconciled is something that I shall not address in today’s letter, but my reason for bringing this up is exemplified by the chart below.
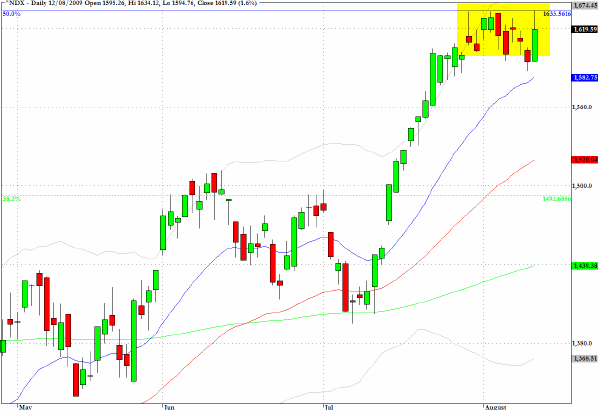
The Nasdaq 100 (NDX) is revealing some remarkable price behavior at the 50% retracement level from its historic high and more recent low. Fibonacci retracements are nowhere to be found in a text on EMH or for that matter in most MBA programs so why does this index seem to be so powerfully attracted to a test of this level? Yesterday’s intraday high literally tagged the level and then retreated. The outcome of the testing of this threshold level will, I suspect, tell us a lot more about the direction of equities in the actionable future than the most diligent discounted cash flow analysis of currrent earnings forecasts.
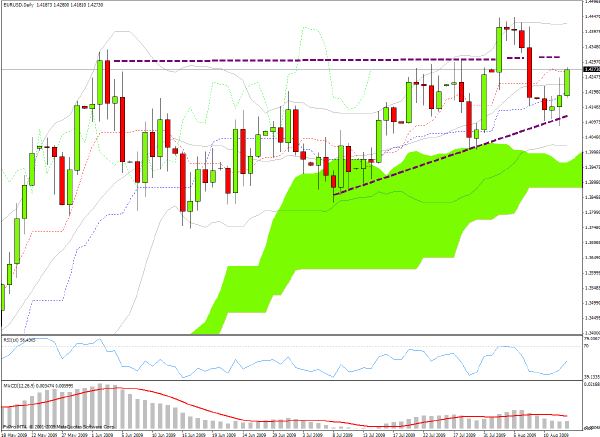
Data released this morning in Europe suggests that both France and Germany experienced slightly positive moves up in GDP growth, and the pundits are talking about the end of the Eurozone recession already.
The euro is getting a bid against the dollar and now has to confront, yet again, the $1.44 barrier against the dollar.
The stage is being set for a new battle where improving economic fundamentals, at least as perceived from Canary Wharf and Wall Street, will be challenging some of the comfy correlation plays which have prevailed during the recent "difficulties" in the money market.
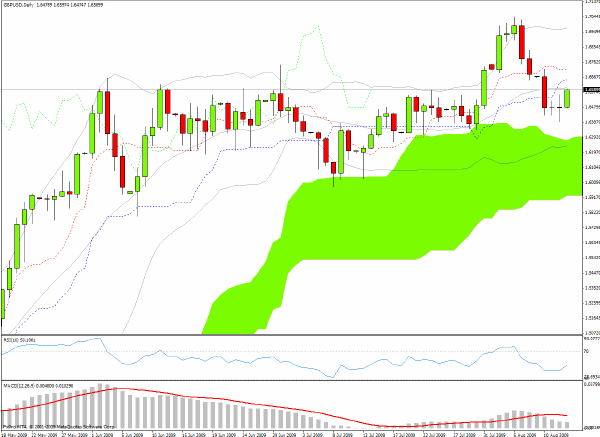
Sterling remains in a wait-and-see mode for me at present but is deteriorating in the cross rate with the Euro.
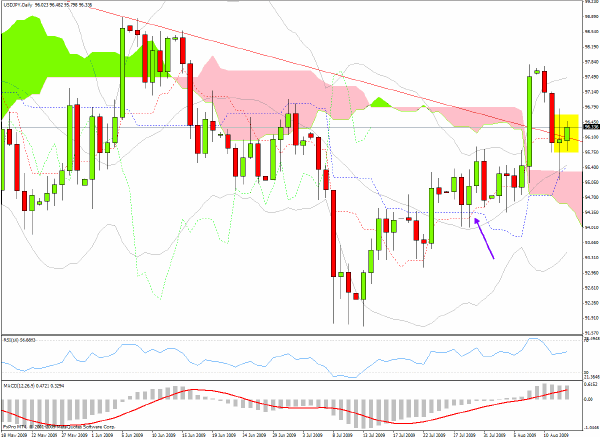
As mentioned yesterday, the USD/JPY cross is catching my attention and this morning during the European session has now regained a position above the descending trendline following the recent whipsaw behavior.
The 97.50 would seem to be a target in today’s session and if that is sliced through decisively the longer term outlook is for dollar strength, at least with regard to the Japanese currency.
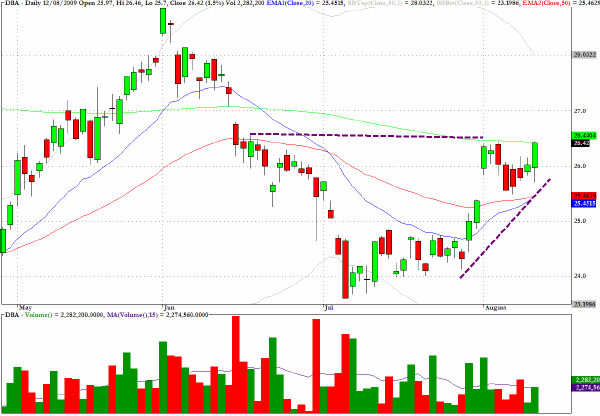
DBA, a sector fund which allows one to take a position on agricultural commodities looks to be preparing for a move up from an ascending wedge pattern but a more attractive entry position could present itself in coming sessions.
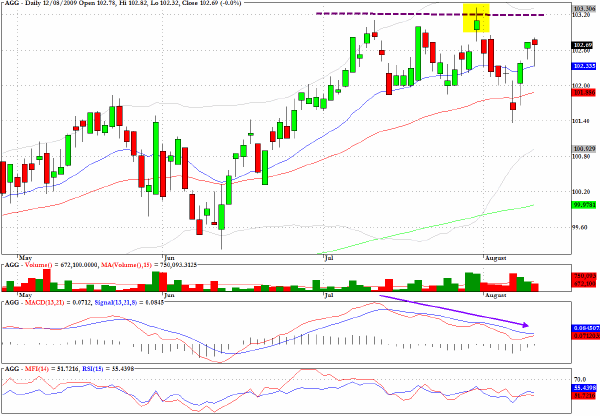
AGG, which tracks the iShares Lehman Aggregate Bond Index, is, displaying negative momentum divergences while price is drifting sideways.
Clive Corcoran is the publisher of TradeWithForm.com, which provides daily analysis and commentary on the US stock market.
|