| The McMillan Options Strategist Weekly |
| By Lawrence G. McMillan |
Published
08/14/2009
|
Options
|
Unrated
|
|
|
|
The McMillan Options Strategist Weekly
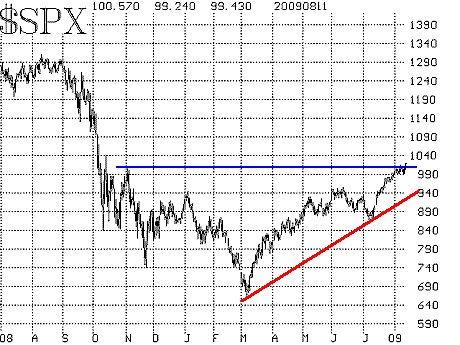
The broad market rally that began in early July hasn't slowed much at all. $SPX closed at a new high and at its highest level since early last October. The $SPX chart thus remains bullish, albeit overextended, as once again it put some distance between itself and its 20-day moving average, which has now risen to about 985.

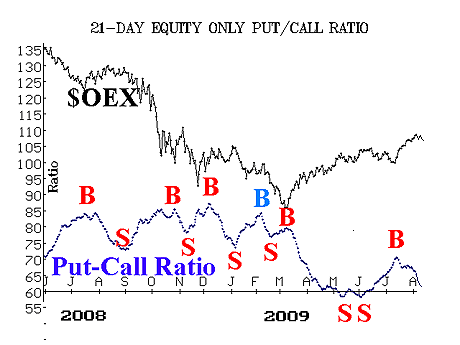
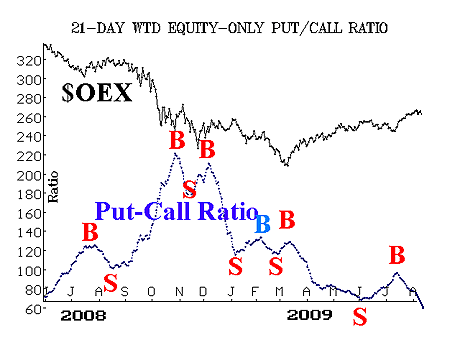
The equity-only put-call ratios remain strongly bullish. They are low on their charts (overbought), but they will stay bullish unless they roll over and begin to rise.

Market breadth remains very overbought, but there appears to be much sidelined cash that is not concerned with such trivialities. Strong breadth readings are positive, but indicate that sharp, but short-lived corrections can spring up at any time.

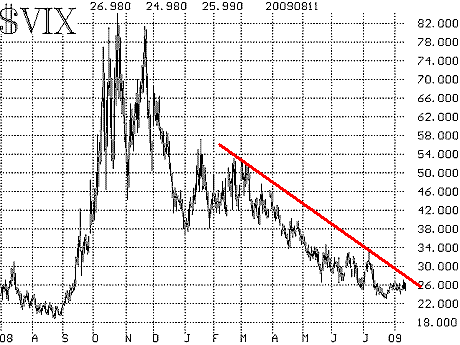
The volatility indices ($VIX and $VXO) declined again, and thus remain in downtrends, which is bullish for the broad market. The actual 20-day historical volatility of $SPX is now down to 14%. Thus, there is still a huge difference between $VIX and actual volatility -- too big, in fact. So something has to give, and grudgingly it seems like $VIX is the one.

In summary, the intermediate-term indicators remain bullish, but the overbought condition indicates that sharp, but short-lived corrections can be expected.
Lawrence G. McMillan is the author of two best selling books on options, including Options as a Strategic Investment, recognized as essential resources for any serious option trader's library.
|