| The Statistical Recovery, Part 2 |
| By John Mauldin |
Published
08/16/2009
|
Currency , Futures , Options , Stocks
|
Unrated
|
|
|
|
The Statistical Recovery, Part 2
A few weeks ago I first used the term "statistical recovery" to describe the nature of today's economic environment. Today we are going to further explore that concept, as it is important to have a real understanding of what is happening. This coming "recovery" is not going to feel like a typical one, and those expecting a "V"-shaped recovery are simply making projections from previous economic recoveries, which, based on the fundamentals, are not warranted. And of course, a few thoughts coming back from Maine are in order. There is a lot to cover, and this may take more than one letter.
The Statistical Recovery
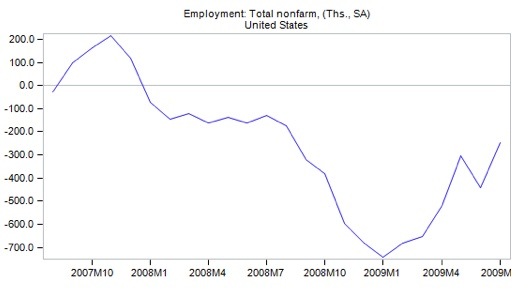
The unemployment numbers came out last Friday, and Steve Liesman of CNBC did several interviews live from Leen's Lodge in Maine. I postponed an hour of fishing to be on air with Martin Barnes (of the Bank Credit Analyst) to comment on the numbers. Everyone seemed quite excited that the US lost "only" 247,000 jobs. However, it is still almost twice as large as a year ago, and at that time 128,000 lost jobs seemed pretty bleak. However, comparing it to the average of 692,000 lost jobs per month in the first quarter, those looking for good news immediately started talking about how a recovery is around the corner.

The unemployment numbers are some of the most seriously revised numbers in all of government data. The first monthly estimate is notoriously imprecise. Why people make investment decisions based on this release is beyond me. As I mention continuously, because of seasonal adjustment factors, the unemployment numbers understate job losses in a recession and also understate job gains in a recovery. About the most we can get from the current data is the broad trend. Admittedly, the trend is getting better, but we are still in a hole and no one has stopped digging.
What we can see is that we are down 6.7 million jobs since the beginning of 2008! We have roughly eliminated the job growth of the last five years. And that does not take into account the 150,000 new jobs that are needed each month just to maintain the employment rate because of the increase in population. It took 55 months once the 2001 recession was officially over to get back to the previous employment peak. That is 4.5 years, gentle reader, and we are further down now and faced with massive deleveraging. It is going to take a lot longer this time. Let's look at some of the reasons why.
I took a different tack in the CNBC interview. I pointed out that even though it is possible (likely?) we will see a positive number for GDP for the third quarter, it is not going to feel like a recovery for quite some time.
By the middle of next year (2010), when I think we will finally hit an unemployment bottom, we will be down close to 8 million jobs, wiping out all the jobs created since the middle of 2004. Unemployment is likely to be more than 10%, unless they keep playing games with the number.
A Recovery Statisticians Can Love
What I mean by that remark is that the unemployment number went down even though we lost 247,000 jobs. How can that be, you ask? Well, the government assumes that if you were not looking for a job within the last month, then you are not unemployed; therefore, on a statistical basis the number of people unemployed went down by 400,000. (There are 2.3 million such discouraged workers.) More in a minute on the problem that will cause down the road.
Assume that we will need 9 million jobs over the next five years (150, 000 jobs a month for 60 months) and add the 8 million lost jobs. That means we have to add 17 million jobs in the next five years to get back to the 4.5% unemployment of 2007, let alone the under-4% we saw in 2000.
That means we need to grow employment by about 12% over the next five years. But it's worse than that. What is known as U-6 unemployment is over 16%. There are another approximately 8.8 million people who are either working part-time but want full-time jobs or are among the 2.3 million discouraged workers as mentioned above.
(The definition of U-6 unemployment from the BLS web site: "Marginally attached workers are persons who currently are neither working nor looking for work but indicate that they want and are available for a job and have looked for work sometime in the recent past. Discouraged workers, a subset of the marginally attached, have given a job-market related reason for not looking currently for a job. Persons employed part time for economic reasons are those who want and are available for full-time work but have had to settle for a part-time schedule." http://www.bls.gov/news.release/empsit.t12.htm.)
Let's make the assumption that the part-time workers want to go to full-time (which they say they do). Typically employers will increase the hours of part-time employees before adding new workers. That will be a major drag on potential job growth. It is the equivalent of creating at least 4 million jobs, except that no new jobs are created. Plus, those who want jobs but are not looking will come back into the market if jobs are available. That adds another 2 million. Now we are seeing the need for 23 million new jobs in five years, to get back to the "Old Normal."
That is an increase of 15% total employment from today's levels over the next five years. That type of jobs growth will only happen with significant economic growth. Normally, you should expect the economy to rebound to at least 3% trend GDP growth. That is what has happened historically. But we are not in the Old Normal. We are entering the era of the New Normal, where looking back at historical trends will prove to be misleading at best.
On average, and VERY roughly, you would think you would need a minimum of 15% real GDP growth over five years to get us back to what we think of as acceptable levels of unemployment. Actually you would need more, as productivity growth lessens the need for more workers. Oh, and add in the Boomer-generation workers who are not going to retire because they now cannot afford to.
(I think we will be lucky to have 10% real GDP growth in the next five years, for a host of structural reasons that we will be going into below and over the next few weeks.)
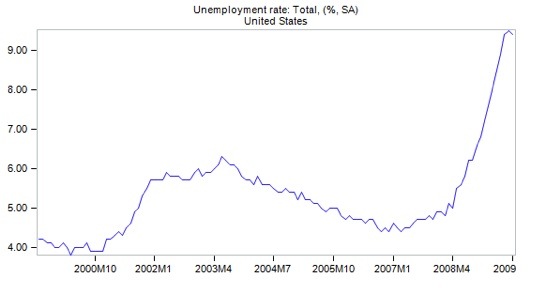
Unemployment will be rising for at least another two quarters and probably through the middle of next year. That should not surprise us too much, as unemployment kept rising for almost two years after the last recession, which many dubbed "the jobless recovery." The recession ended in 2001, but as the graph below shows, the unemployment rate rose until the middle of 2003.

We may have a "statistical recovery." The numbers may be positive for a variety of reasons only a statistician could love, but it is not going to feel like a recovery to the rest of us. Maybe that is why consumer confidence took another hit today, dropping to its lowest level since March, helping to drive the market down.
The economists at economy.com, who normally have a bullish tinge to their writing, said it succinctly: "Confidence will struggle to gain ground in the months to come, as consumer budgets remain stretched. Little wage income, prospects for reduced bonus payments, reduced access to credit, and no capital gains are all constraining consumers' ability to meet their financial needs and recover from the sharp drops in wealth they have experienced. Many consumers are struggling to pay their debts. Supports are coming from reduced layoffs, equity market gains, and stimulus such as the cash for clunkers program, but that is proving inadequate to lift spirits so far. It will likely be some time before conditions turn enough for confidence to improve decisively. Key drivers of confidence include developments in the labor and housing markets and the path of energy and equity prices."
(My friend Bill Bonner described the Statistical Recovery as being just like a female impersonator. He is just like a real woman in every way, except for the essential ones.)
The consumer's sense of discomfort is shared in executive suites across the country. "Chief Executive Magazine's CEO Index, the nation's only monthly CEO Index, dropped to 63 in July, after showing gradual improvement. All components of the index are down, with Employment Confidence taking the largest hit...
"What's worse is that pessimism over employment is reaching new heights. The Employment Confidence Index declined 25 percent with 57 percent of CEOs expecting continued decrease in employment next quarter. Over 95 percent rate the current employment environment as bad—the highest level for 2009. Less than 5 percent think employment conditions are normal and virtually no one (0.4 percent) thinks they are good." (The Bill King Report)
A Few Thoughts on the Housing Market
Bill also sent me a link to a very interesting survey of the real estate market. Those in the real estate business will find this of value, although it makes for grim reading. (http://www.campbellsurveys.com/AgentSummaryReports/AgentSurveyReportSummary-June2009.pdf)
Three (of the sixteen) of their summary bullet points stood out:
-- The market for home purchases can be divided into segments of 26% for damaged REO, 23% for move-in ready REO, 14% for short sales, and [only!] 36% for non-distressed properties. [REO means "real estate owned," typically by a bank as a result of a foreclosure.]
-- 43% of homebuyers are first-time homebuyers, 29% are current homeowners (relocation or retirement homes), and another 29% are investors.
-- Only 31% of non-REO home sale listings are unforced or optional; other major reasons for listings include financial stress (including short sales), long distance relocation, and divorce or estate sales.
Think about that for a minute. Two-thirds of home sales are either foreclosures or banks taking a loss on the mortgage. Of the remaining 36%, only 10% are as a result of something we could call a normal selling process. And that is nationwide. There are lots of places where foreclosures are low. Reading this report anecdotally, there are large areas (California, Nevada, Arizona, Florida) where almost the only housing action is distressed or forced sales, that is, sales at a significant discount to original asking price.
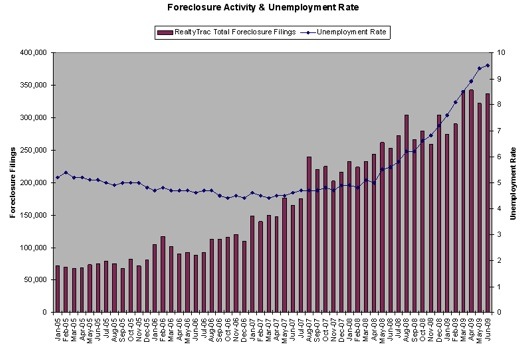
Look at the chart below from Rick Sharga at RealtyTrac. Today we learned from them that foreclosures set a new monthly record of 360,149 properties that received a default or auction notice or were seized last month. One in 355 households got a filing, the highest monthly rate in RealtyTrac records. Many hard-hit areas have rates higher than 1 in 39 homes! Foreclosures are now running about six times higher than just four years ago.
And there is little relief in sight. There is typically about one foreclosure for every 6-10 jobs lost. It will be higher this cycle, as so many homebuyers are underwater on their mortgages and have little incentive to try and keep up payments while they are unemployed. Further, there are 500,000 REO-owned homes that are not on the market as of yet (what Sharga calls shadow inventory), and a wave of foreclosures will result from option ARMs and Alt-A loans resetting next year. Note: July's record numbers are not in the chart below.

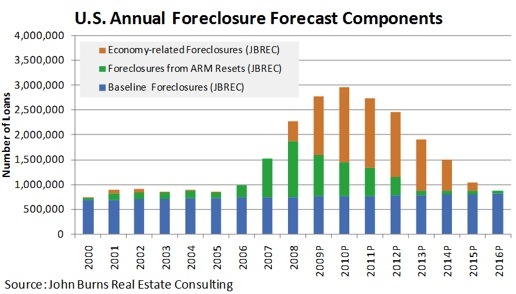
John Burns gives us the next graph, which is an estimate of foreclosures for the coming years. (www.realestateconsulting.com)

Notice that he estimates more foreclosures next year than this year, with very little relief until 2014! This does not bode well for housing prices, which are a big factor in consumer sentiment, which is a big factor in consumer spending.
It does mean that renters can find some very good deals, as there are now areas (like Phoenix) where it is cheaper to buy smaller homes than to rent. Remember the statistic above that first-time home buyers are 43% of the market and investors another 29%? Lower prices make housing more affordable, and with the government incentive programs for first-time buyers really working (for once), the lower end of the housing market may actually stabilize sooner than the overall market.
As I wrote almost two years ago, the housing market will not bottom before 2011 and maybe into 2012. We just built way too many homes in our exuberance; and with tightening lending standards (as there should be) the number of people who can qualify for a mortgage is down, although (again) falling prices make homes more affordable. The median price in California is down by 60%. (Although I saw today where Bill Gross bought a tear-down on the water in Newport Beach for $23 million. That will help the average some.)
Homeowner vacancy rates are close to 3% of total homes, which is well over 2 million homes. Many of these are not yet on the market.
Retail sales were down in July. And that was with Cash for Clunkers in full force. The headlines said that economists were shocked. Really? Consumers are saving more, and actually paying down credit-card and bank debt. We will go into those details more next week, as it is getting close to time to hit the send button.
John Mauldin is president of Millennium Wave Advisors, LLC, a registered investment advisor. Contact John at John@FrontlineThoughts.com.
Disclaimer
John Mauldin is president of Millennium Wave Advisors, LLC, a registered investment advisor. All material presented herein is believed to be reliable but we cannot attest to its accuracy. Investment recommendations may change and readers are urged to check with their investment counselors before making any investment decisions.
|
|