| Corcoran Technical Trading Patterns For August 17 |
| By Clive Corcoran |
Published
08/16/2009
|
Stocks
|
Unrated
|
|
|
|
Corcoran Technical Trading Patterns For August 17
The performance in Asian and European trading on Monday could be shaping up towards a mid-August episode of vertigo for equities. Risk aversion appears to be back with a vengeance as global indices are retreating rather abruptly, and the dollar and yen are strengthening as the safe haven mentality comes back into play.
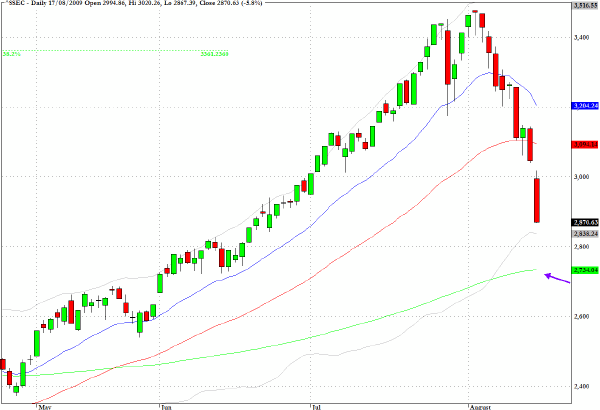
The first chart shows the very sharp correction which is afflicting the Shanghai market and which I have been alluding to in recent commentaries.
The 38% retracement level did pose a major threshold for the Chinese index and since crossing it in late July the market has sold off by approximately 18% including today’s fall of almost 6%.
The 200-day EMA looks like a possible area of short-term relief, but given the re-thinking that is taking place with regard to the Asian dynamo, this chart could almost suggest that a free-fall may be under way.
As suggested last week, those engaged in emerging markets mania, recently in evidence, will have to pause and reflect on just how much risk they want to take on when the rewards are less obvious again.
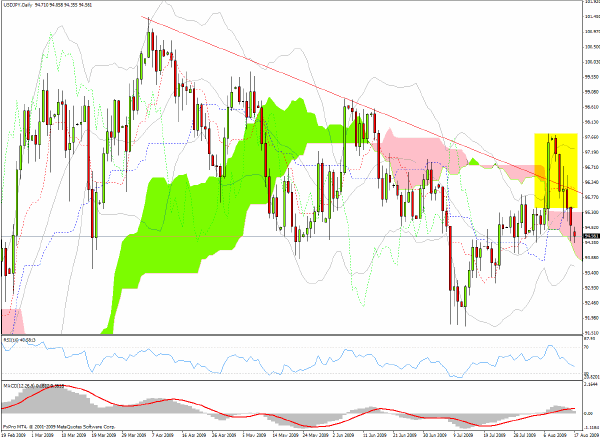
The daily chart of the USD/JPY is one of the most interesting, and in some ways could have acted as a canary in the coalmine for the corrections which now seem to be under way in equities and the re-appearance of risk aversion.
The area highlighted on the charts shows the recent "false" breakout where it appeared as though the US dollar was headed higher, and in turn that the relative safety play of yen strength was dissipating, suggesting a growing appetite for more speculative risk was taking hold.
Over the last few sessions the failure of the breakout was catching my attention and we are now facing the all-too-familiar forex scenario where the dollar is catching a bid against most currencies, especially the commodity currencies - AUD,CDN,NZD etc, but not against the yen.
For those following the big macro themes in the market, this kind of forex alignment is a great barometer which is indicating a renewed souring of sentiment towards equities, commodities and adventurous risk taking.
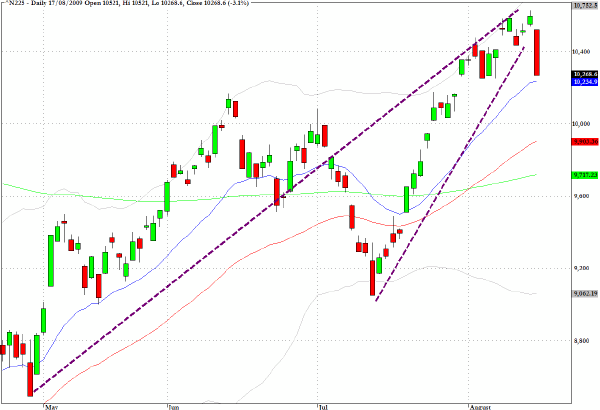
The Nikkei 225 dropped by 3% in Monday’s Asian trading session and I have drawn in the rather disturbing wedge formation which could also be pointing to difficulties ahead for this market which had been showing relative strength in recent weeks.
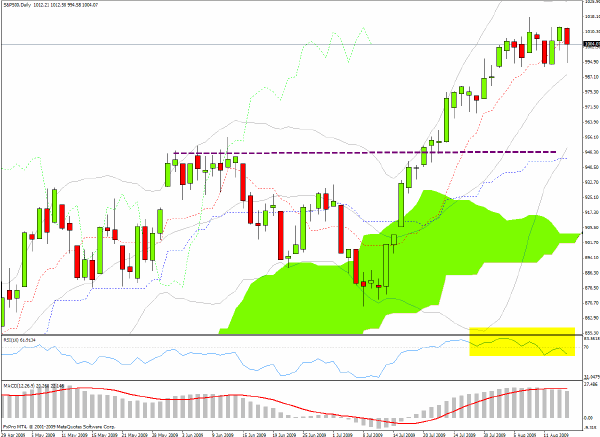
The S&P 500 has notably failed to take out the 38% retracement level in the region of 1014 and may encounter some heavy going in today’s session. Although the bears will have difficulties in gaining control of the agenda while the algorithmic bias is still upwards, there is a plausible case that suggests that support levels around 950 may have to be tested again.
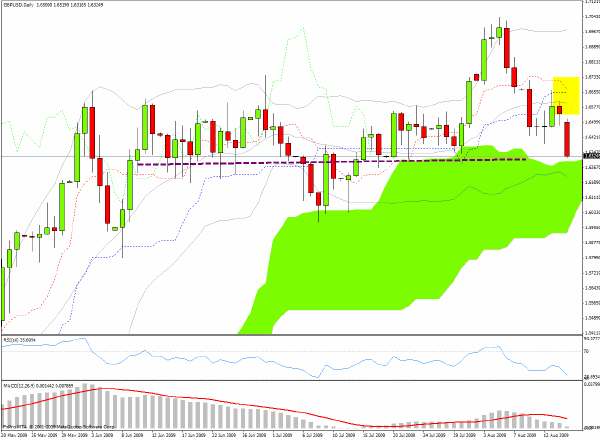
Sterling is getting closer towards giving a clear Ichimoku sell signal on the daily chart.
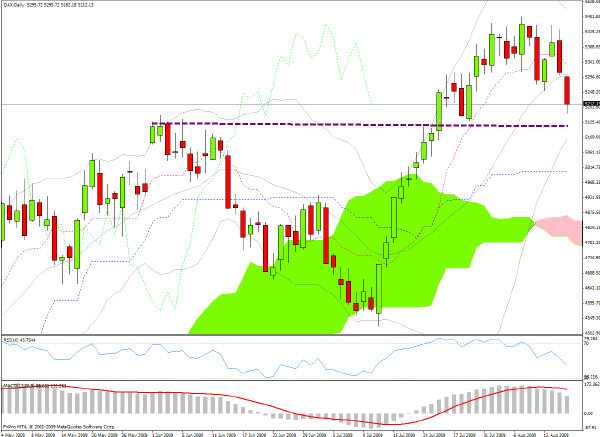
The German Dax index at the time of writing this on Monday morning is down by two percent and reviewing the chart below one can see that support exists around 5155. On the daily chart the RSI chart shows a rolling top negative divergence pattern but the Ichimoku configuration does not look overly bearish at this time.
Clive Corcoran is the publisher of TradeWithForm.com, which provides daily analysis and commentary on the US stock market.
|