| Corcoran Technical Trading Patterns For August 18 |
| By Clive Corcoran |
Published
08/17/2009
|
Stocks
|
Unrated
|
|
|
|
Corcoran Technical Trading Patterns For August 18
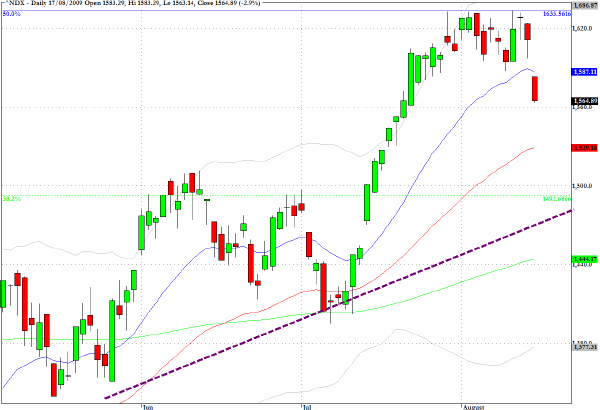
After the series of candlesticks indicating decision avoidance as the Nasdaq 100 (NDX) approached the 50% retracement level, the pattern resolved itself yesterday with a significant gap move downwards.
Based on the formations seen on the chart, a retreat to the 1500 level on this indeed would seem like a realistic intermediate-term target.
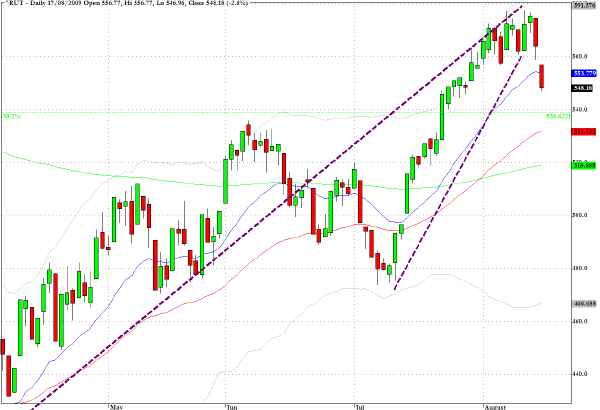
The Russell 2000 (RUT) reveals a breakdown from a wedge pattern which suggests that a trend inflection has been reached. It may be that the index will move sideways as did the general market in May following similar patterns seen on other charts, but in the intermediate term a more prolonged correction seems to be the more likely scenario. A retreat to the 530 area where the 50-day EMA coincides with other support/resistance levels visible on the chart may well be the first target for the bears.
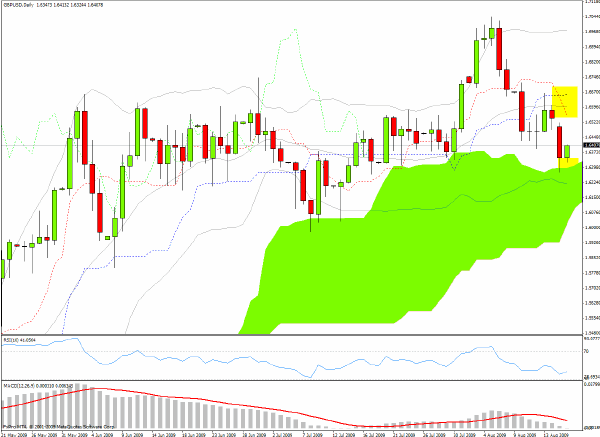
GBP/USD, the currency pair of sterling against the US dollar provided the sell signal on the daily Ichimoku chart in yesterday’s session. It is not uncommon, however, to see a pullback and respite rally before the downward move gathers momentum.
The intermediate-term target would be another test of the $1.60 level.
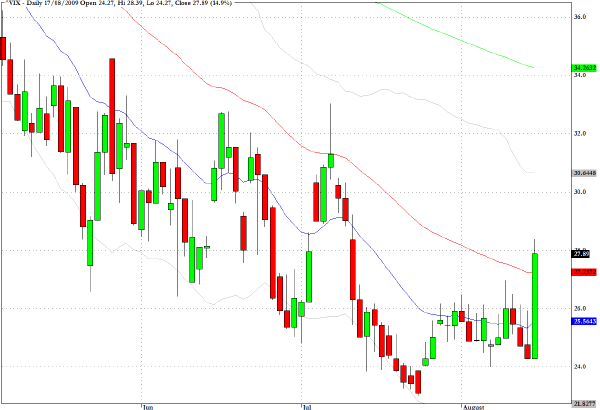
The VIX posted one of its largest green candlesticks for some time, and is now poised to break above a descending trend-line which extends back to the March recovery.
One reader recently contacted me and suggested that the macro focus of the commentary was commendable but that more specific stock recommendations would be useful. I have been less focused on individual equities recently because I have found the macro picture so fascinating and believe that there are some forces at work in the US equities arena which make me somewhat cautious regarding a number of traditional TA indicators.
Having said that, I shall just draw attention to one of the specific suggestions made here last week.
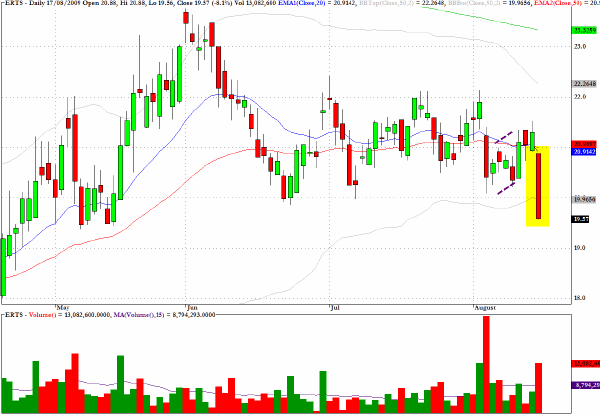
Electronic Arts (ERTS) sold off on substantial volume last week and could hit resistance at the $21 price where two moving averages have converged.
Another specific recommendation made in my commentary last Wednesday could have been profitable.
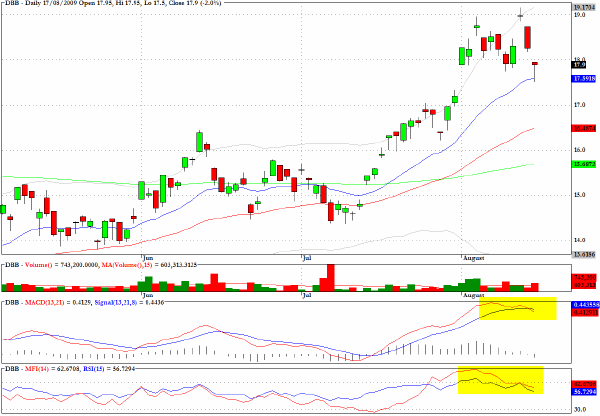
DBB, a sector fund which tracks base metals, looks technically vulnerable.
The following recommendation was made in last Tuesday’s column and could have provided generous profits.
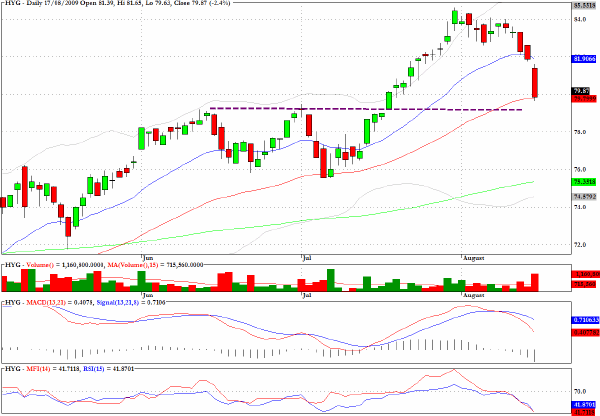
HYG, a sector fund which tracks high yield debt could correct in the medium term to the level of support indicated on the chart.
The following also appeared in last Tuesday’s column.
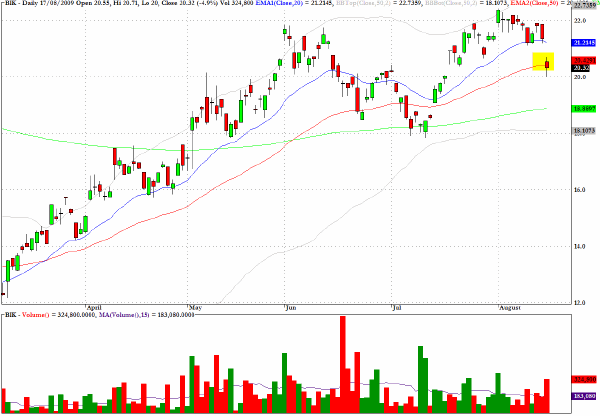
BIK, an exchange traded fund which tracks the BRIC emerging market sector, has been revealing some negative divergences and increasingly there is case which could validate a double topping pattern. Having said that, the volumes are thin at present and with many looking to buy dips in all kinds of exotic markets there could be a further wave of ebullience so I suspect that there will be a better time to position oneself for what could be a really nasty sell-off in emerging markets when the larger cap US indices do decide to take their well-earned rest.
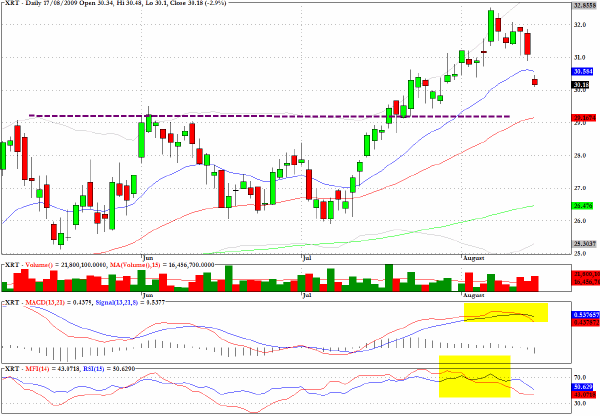
XRT, the SPDR version of a sector fund which tracks retail, seems headed towards $29.
Clive Corcoran is the publisher of TradeWithForm.com, which provides daily analysis and commentary on the US stock market.
|