| Is Liquidity The New Volatility? |
| By Price Headley |
Published
08/21/2009
|
Currency , Futures , Options , Stocks
|
Unrated
|
|
|
|
Is Liquidity The New Volatility?
It's as if I've been reciting the phrase in my sleep, whether it's how financially hip it sounds or how deeply researched it has been. It is clearly very important for the future of our market. Credit as it's generally called, refers to the depth and frequency of short-term loans being made (or not) throughout the economy. In the fall of 2008 credit problems were delivered to the dining table in mass via the clever analogy, credit freeze, which became the major culprit in the financial meltdown. As we approach September (12 months after the fallout) more analysts suspect similar problems are lingering around the corner. For traders like you and I this could mean more violent market swings. Below I want to explain how to monitor credit to help you take advantage of another wave in volatility (or liquidity). Specifically, I'll show you charts of credit (TED spread) relative to an old friend (the VIX) and how liquidity may be the new volatility.
Just yesterday, Warren Buffet described the financial horizon as a hangover, which of course depicts a negative backlash to the absurd amounts of cash printed in the past year. In a recent Fortune article, 'Inside the Trillionaires' Club' about BlackRock's inner workings Larry Fink described that liquidity has become more important than ever.
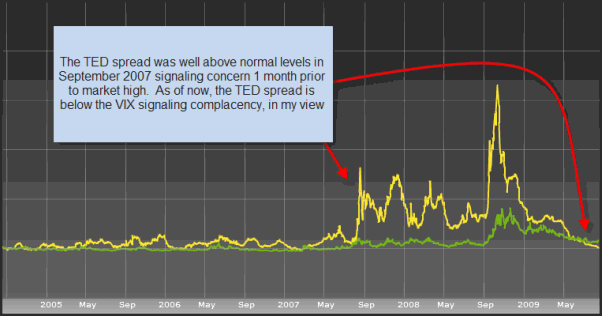
CBOE Volatility versus TED spread - 5 Year (VIX:GREEN - TED SPREAD:YELLOW)

Since market volatility spiked to record levels in the past twelve months traders have increased focus on volatility measures like the CBOE VIX, but liquidity measures have fallen off the map. From a contrarian standpoint this concerns me-it signals complacency in our ability to lend. Did we come too far too fast? If liquidity is the new volatility then traders should routinely check TED spread charts for insight and analysis.
But what exactly is the TED spread? It's the difference between the short-term LIBOR rate (London Interbank Offered Rate) and the yield on 3-month U.S. Treasuries (a 'risk free' yield). The formula is simple enough....subtract the 3-month Treasury yield from the LIBOR rate, and you're left with the TED spread. To be clear, when the TED spread is high (as in 3.0 or higher) banks are less likely to lend or borrow and when it's low or normal (below 1.0) banks are lending.
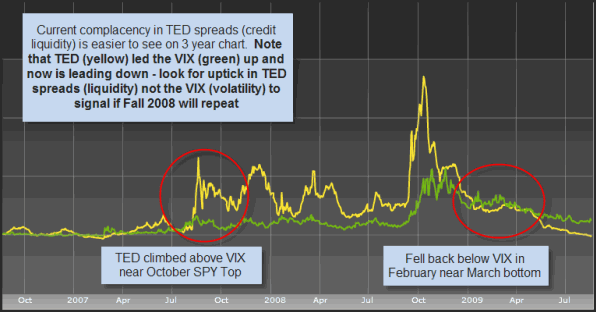
The first chart above shows little to no correlation between market fear (CBOE VIX) and credit liquidity (TED spread), at least until last September 2007 when the TED spread skyrocketed IN FRONT OF volatility. This worrisome spike occurred 1 month prior to the market high. If you zoom in further to the last three years (chart below) you can see more recent relative performance. Look closely and you will notice even more evidence that the TED spread led volatility in exposing the market downturn. Specifically, the TED spread, as a hyper-focused liquidity (or fear) measure for financials, may help signal future financial led sell-offs.
CBOE Volatility versus TED spread - 3 Year (VIX:GREEN - TED SPREAD:YELLOW)

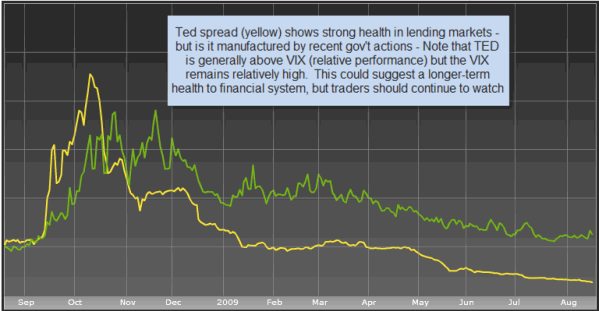
Since pictures are worth a thousand words, let's drill down to the past 12 months of relative action between the VIX and the TED spread. (I'd like to thank Bloomberg.com for the charts today) Notice how the extreme move in the TED spread compared to the VIX. The so called 'credit freeze' dwarfs the spike in volatility. If you look closely, all the 'credit freeze' chatter started right when the TED spread surged from just above 1.0 to above 3.0, and as high as the mid-4.0 area. Take a look at the chart, and then keep reading for my final thoughts
CBOE Volatility versus TED spread - 1 Year (VIX:GREEN - TED SPREAD:YELLOW)

In hindsight, over the past two years liquidity, as measured by the TED spread, worked better than the VIX in timing the financial meltdown. Going forward, market mavens such as Larry Fink believe that liquidity is more important than ever and will be critical for years to come. In my view, it's hard to 'replace' volatility as a useful market tool, but the above shows good reason to broaden your research. Specifically, keep a close watch on the relative movement between the VIX and TED spread to help determine if a resurgence of financial turmoil will return.
Price Headley is the founder and chief analyst of BigTrends.com.
|