| Corcoran Technical Trading Patterns For August 21 |
| By Clive Corcoran |
Published
08/21/2009
|
Stocks
|
Unrated
|
|
|
|
Corcoran Technical Trading Patterns For August 21
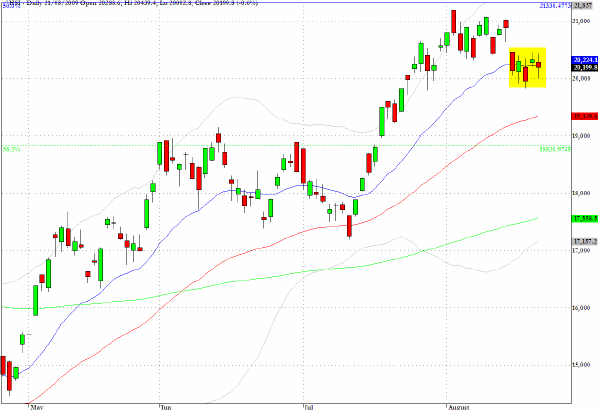
Asian markets staged a late session recovery with the Hang Seng Index in Hong Kong moving from a more than 300-point loss at one state, with an intraday drop down to the 20,000 level, but a rally to close the session with a less than one percent decline.
Macro asset allocators are continuing to monitor the Asian markets closely as the upward bias which still seems implicit in the micro-structural machinations of the US market could potentially come off the rails if the Chinese government is serious about arresting a bubble in the making and the notion of an anemic global recovery gains more believers.
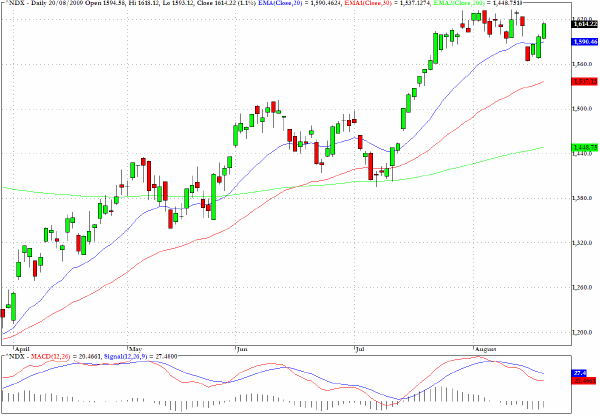
I would like to sketch two possible scenarios for the Nasdaq 100 (NDX), which would also apply to several other indices:
1. A pullback in coming sessions will take us back towards the recent highs at which point renewed sellers will seize the opportunity to exploit the imminence of a correction, which has been lurking on the chart pattern for some time.
2. A late August rally will take the index to new highs above the 50% retracement level but with a clear negative momentum divergence. This would be in accordance with the current configuration of the MACD chart which has room to show another momentum push but where the chances of a negative divergence would appear to be high.
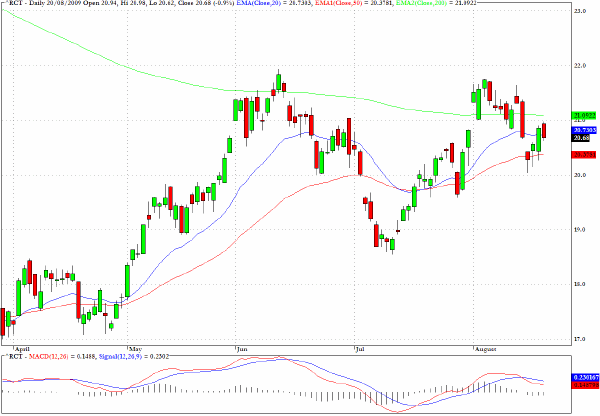
The Rogers Commodity Index (RCT) moved above the 200-day EMA in mid June, subsequently slipped back beneath it, and then made another crossing of this critical level in late July and early August. Notably, levels achieved here were at a slightly lower level than those seen in June.
Another attempt to cross the threshold (green line on the chart) now has the added complication that it does appear to be in the context of a bearish flag developing on the chart.
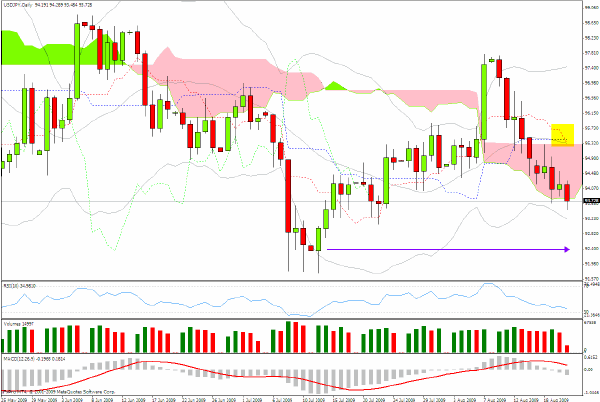
The US dollar/Japanese yen cross rate would seem to be headed towards a retest of lower levels seen in July at the 92 level. Highlighted is an Ichimoku crossover but qualifying my conviction in this signal crossover is the fact that the daily cloud configuration is not supporting a sell recommendation. In addition, the possibility exists of a positive divergence ahead on the MACD and RSI charts.
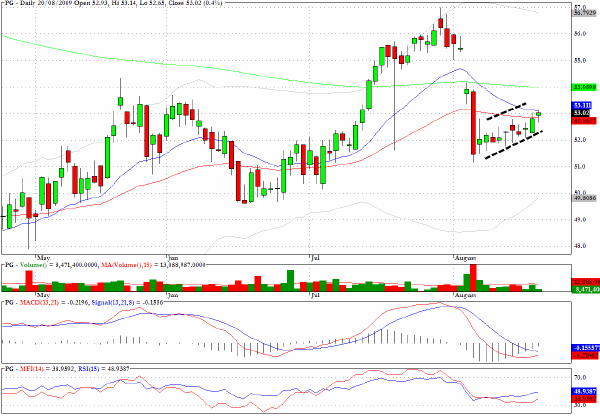
Procter and Gamble (PG) has an extended pullback pattern and looks vulnerable near to current levels.
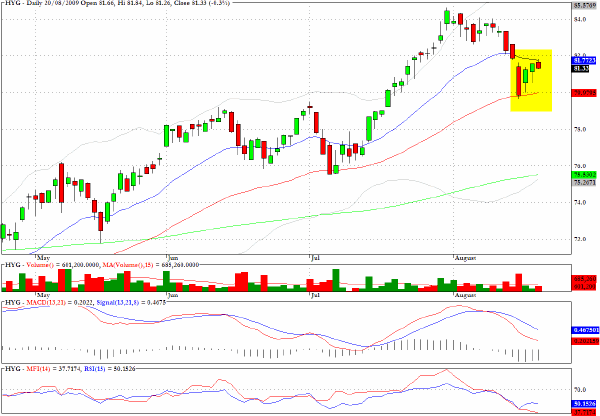
HYG, a sector fund which tracks high yield debt, is also tracing a bear flag pattern.
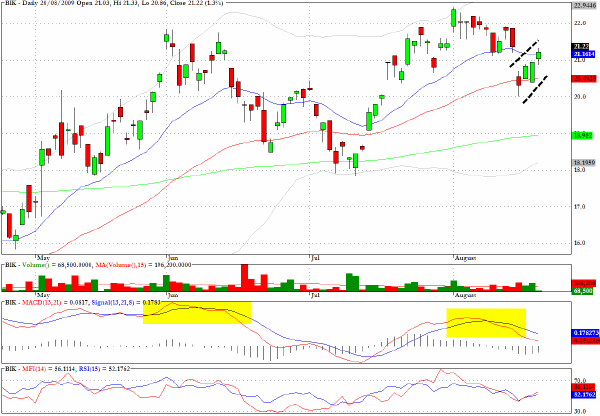
Yet another bear flag pattern is evolving on the chart for BIK, an exchange traded fund which tracks the BRIC emerging market sector.
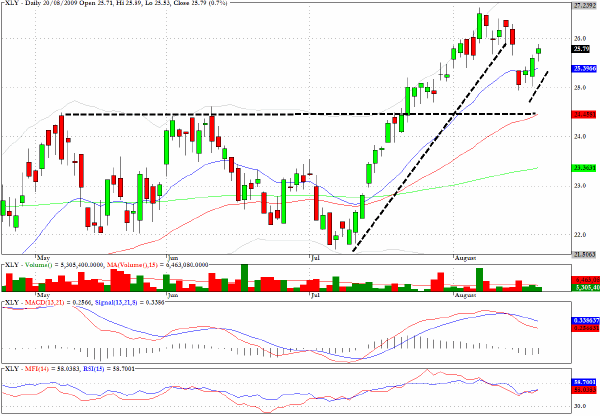
The consumer discretionary stocks, as tracked by XLY, are also in a pullback pattern which may hit resistance not far above current levels.
Clive Corcoran is the publisher of TradeWithForm.com, which provides daily analysis and commentary on the US stock market.
|