NASDAQ COMMENTARY
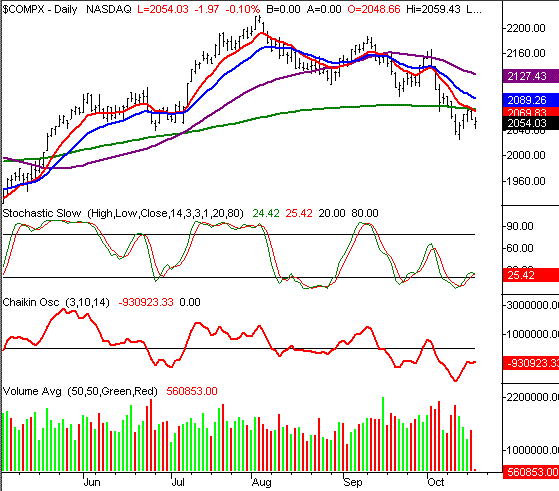
Monday's rally ended up being only a false start, with the NASDAQ's heroic rise to the 10 day moving average (red) being reversed on Tuesday. We're even lower today (so far), and haven't been able to rival yesterday's high of 2072.50.....also right where the 10 day moving average was then. The composite also hit resistance at the 200 day line (green), which is a bit of a bigger picture problem.
Yet, we're still hesitant to say that this is a sign of further losses on the horizon. Normally all of these signs would suggest the NASDAQ is headed lower, but the one thing we've seen too often this year is indecision. That has led to multiple reversals, and ultimately created a choppy environment that's been challenging to trade. That's where a reversal-based tool like stochastics comes in, and that's why we're not counting the bulls out just yet.
Technically speaking, we got a stochastic buy signal yesterday, when the second stochastic line (%D, red) crossed above that oversold threshold at 20. So far it hasn't panned out, but then again, the stochastic signals can take a few days to materialize. Is the resistance at the 200 day line a worry then? Yes, and no. Don't forget that the 200 day line really didn't mean much when we last crossed encountered it in the spring. We always want to watch it, but in a sideways environment like we've been in all year, it's going to be encountered repeatedly.
So here's the basic plan......we need to see a cross above the 10 and 200 day lines to get bullish. They're both around 2070 right now. We won't be able to get bearsih unless we see a close under last week's low of 2025.58. Until then, we seem to be stuck in the mud.
NASDAQ CHART

S&P 500 COMMENTARY
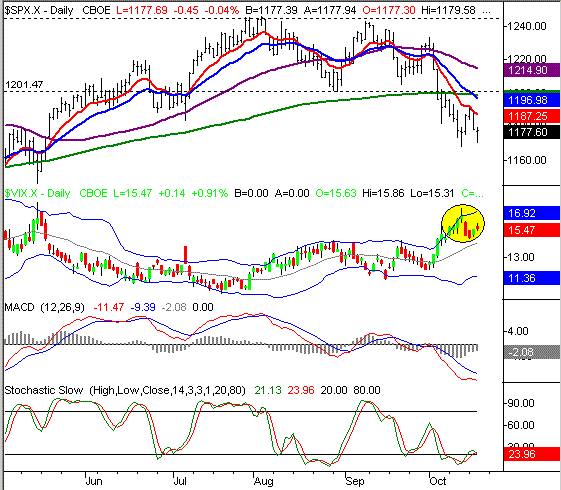
In Saturday's Weekly Market Outlook, we pointed out that the CBOE Volatility Index (VIX) looked like it was finally going to pull back from its surge to 17.19. That would have been bullish for stocks, and was for a day or two. But now, the VIX is on the rise again, undoing those two days of bullishness. But as with the NASDAQ, we're not going to give up so soon; the VIX still hot a peak, and the market still hit a bottom on Thursday. Neither have yet to revisit those levels, and as long as they don't, we're not going to jump on the bearish bandwagon.
On the other hand, the resistance the SPX met at the 10 day average on Monday and Tuesday is clear. So, like the NASDAQ, we see this chart as being stuck between a rock and hard place. Unless we can at least break above 1187, we can't be bullish. But if the index manages to stay above last week's low of 1168, we can't be bearish either.
Keep in mind that this week is an option expiration week too, which will only stifle the market's movement. We may not get any decent action until next week.
S&P 500 CHART

DOW JONES INDUSTRIAL AVERAGE
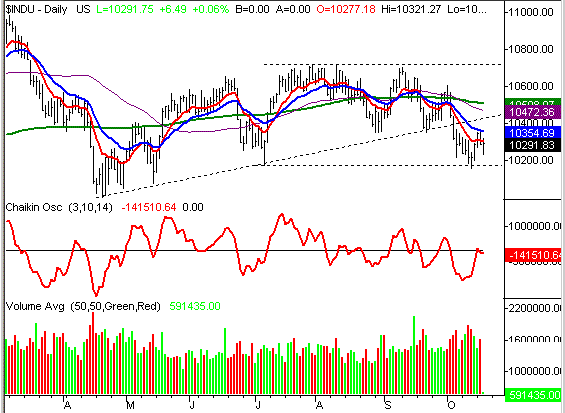
The Dow Jones Industrial Average continues to reign as the champion of charts, with its rise above the 10 day line, and move all the way up to the 20 day line, before resistance was met. It's a dubious honor though, as the Dow's bulls still face trouble ahead (and the sellers still seem to winning the battle).
As it stands right now, the Dow is back under the 10 day line at 10301, although the blue-chip index managed to move above that mark briefly earlier in the day.
Like the other indexes, we need to see one of two possibilities before taking a stance on either side. The 20 day line is clearly a barrier, so we'll want to see a close above 10354 to get bullish again. On the underside, there's still that support line at 10175. That was July's low, and was basically the low from last week too. The nice part is that this range is actually pretty tight (and tightening), so either the bulls or the bears are going to have to play their hand soon.
DOW JONES INDUSTRIAL AVERAGE CHART

BOTTOM LINE
Part of this stagnation is due to the containment effect that option expiration brings, but part of it is also brought on by the nervous folks who saw a nice rally on Monday and Friday, and decided to lock in profits. Neither dynamic is really a surprise. That brings most of the indexes back to where they were two weeks ago, which isn't compelling for any would-be buyers. Just remember that this market has been much more apt to reverse rather than continue, which is why we aren't reading much into the last month's worth of downtrend. Plus, sentiment indications still show a huge peak in fear last week (VIX, put/call ratio), which often occurs at bottoms. Don't force anything here - wait for the good setups.
Price Headley is the founder and chief analyst of BigTrends.com.