| The Statistical Recovery, Part Three |
| By John Mauldin |
Published
08/23/2009
|
Currency , Futures , Options , Stocks
|
Unrated
|
|
|
|
The Statistical Recovery, Part Three
This week we further explore why this recovery will be a Statistical Recovery, or one that, as someone said, is a recovery only a statistician could love. We look at capacity utilization, more on housing, some thoughts on debt and deflation, and some intriguing charts on volatility in the last secular bear-market cycle.
Capacity Utilization Set to Rise
Capacity utilization is a concept in economics that refers to the extent to which an enterprise or a nation actually uses its installed productive capacity. Thus, it refers to the relationship between actual output that is produced with the installed equipment and the potential output that could be produced with it, if capacity was fully used.
The chart below shows that capacity utilization in the US is at an all-time low, around 68%. That means that with the equipment we already have in place we could produce almost 50% more goods than we are now producing. However, most analysts think that 80% capacity utilization is a very good number.
If you look very closely at the bottom right-hand detail, you can see that there is a small uptick in last month's data. Whether or not this is the "bottom" remains to be seen. But if it is not the bottom, it is close. You can only shut down so much production before inventories fall to levels that require restocking. And we are getting close to that level in many industries.
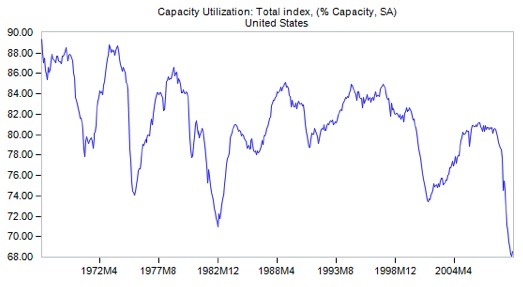
Before we wander too far away from the graph, I want you to notice that past dips (circa the recessions of 1968, '74, and '80-'82) had V-shaped recoveries in capacity utilization. But in the 1990-91 recession it took longer than it did in past recessions, and in the most recent recession (2000-02) the recovery took longer and we did not actually "recover" for four years.
Again, most analysts feel that a capacity utilization of 80% or more is pretty indicative of solid growth. To get back to that level, we would have to see an almost 20% rise in manufacturing. That is unlikely to happen all that fast, for several reasons.
First, consumers are retrenching and saving. We just simply are not going to need or want as much stuff. Second, unemployment, as I noted last week, is crimping the ability of consumers to spend. The recovery we are likely to see is going to be sluggish and not produce new jobs for quite some time. Again, that stifles demand.
The country (and the world) is adjusting to the New Normal. It is some level of overall economic activity that is different than what we have enjoyed during the reigning paradigm of the last 30 years.
Manufacturers are going to ramp up more slowly than in the past, especially as many companies have the ability to tailor their production to consumer demand much faster now, due to automation.
As I have repeatedly said, the world is awash in excess capacity. We simply built too much productive capacity to be utilized in the New Normal. One way of dealing with too much capacity is to simply close the plants. That is what is happening in the paper and memory-chip industries. Other industries are engaging in mergers to reduce or "rationalize" capacity. While that process is a good thing, it does mean that unemployment rises or stays higher longer.
The building of inventories counts as a rise in GDP. Conversely, reducing inventories gets counted as a lack of growth. We have just about reduced inventories all we can. As companies begin to rebuild inventories, that will translate into a statistical increase in GDP. But if capacity utilization is still only (say) 73%, it still shows a weak economy with not many new jobs and reduced corporate profits, compared to a few years ago. It will be a rather long time before the jobs that have been lost this cycle will come back. Will the statistical comparison of data from a year ago look positive? Are things improving? The answer will be yes. But it will not feel like it for those who are looking for new jobs or higher income or more sales.
Look at it this way. We have dug ourselves into a 12-foot hole over the past two years. The data now suggests that we have stopped digging, which is always a good idea if you are in a hole. At some point we will have figured out how to add some dirt to the bottom to get us back up to an 8-foot hole. Will we be better off statistically? Absolutely. But we will still be in a hole. Unemployment falling back to 8% in 2011 will still feel like we are in a hole, but the statistics will say GDP is positive. And that is because we are so far down, the year-over-year comparisons are starting to look good.
As an aside, it would be highly unusual for inflation to show up with low capacity utilization and rising unemployment. Businesses and workers simply do not have pricing power.
A Real Estate Green Shoot?
The housing news has been less bad of late. Home-builder sentiment is marginally higher. Today we learn that sales are up month-over-month, and actually year-over-year, on a seasonally adjusted basis, which is some of the best news on the housing front we have had in two years. Sales of existing homes were the highest since August of 2007. Have we seen the bottom? The following chart shows that while actual homebuilding activity is still down, the annual comparisons are getting easier and activity seems to be leveling out.
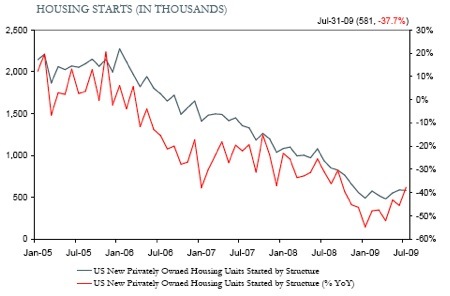
Note, however, that this is yet another aspect of the Statistical Recovery. For two years, the continual drop in home building reduced the GDP numbers every quarter. If homebuilding activity simply stops falling, as it appears to be, then housing will stop being a negative as far as GDP is concerned. Will we get back to the levels of 2005? Not for many decades and with a much larger population. We are now finding the New Normal as far as home construction is concerned.
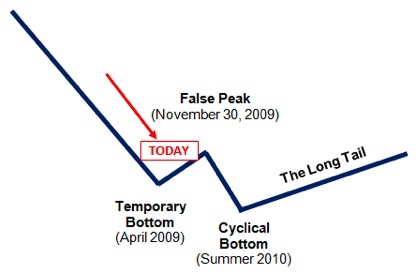
And before we get too celebratory, my friend John Burns of John Burns Real Estate Consulting suggests we may be seeing a false bottom. What we are seeing is the result of a government program that offers first-time home buyers $8,000 if they buy a home by November 30; and that program is working, especially at the lower end of home prices (as you would expect, and as it should.) 31% of home sales in July were involved with this program. But like Cash for Clunkers in automobiles, this is pushing demand for homes from next year into this year.
John offers us the following chart that gives us what he thinks is happening in the markets, from his surveys. He thinks that we saw a "false bottom" in April of this year and that activity will peak in November, before going on to the actual bottom, from which there will be a long, slow recovery.
There are millions of homes being brought onto the market through foreclosures -- two million vacant homes for sale, plus, builders are still building. It will simply take some time to work through the inventory.
There are some who wonder why home builders keep building if inventories are so high. First, for many of the larger public companies, to stop activity altogether would be commercial suicide. You can't just stop without dying. Further, many of them have financial commitments that require them to build in order to make something to pay back the loans, even if they lose money. Maybe they won't build McMansions or in Florida, but they will find out what will sell and where and build there. Smaller builders have the option of not building "spec" homes (homes built without a buyer already lined up, that is, on speculation). Like my neighbor who just tore his house down this week (can they ever do that fast!) and plans to build a large new home, much of the home activity will be pre-sold for the next few years. (I can't tell you how much I look forward to the sound of hammers and saws next door as I write and read.)
The Deleveraging Society
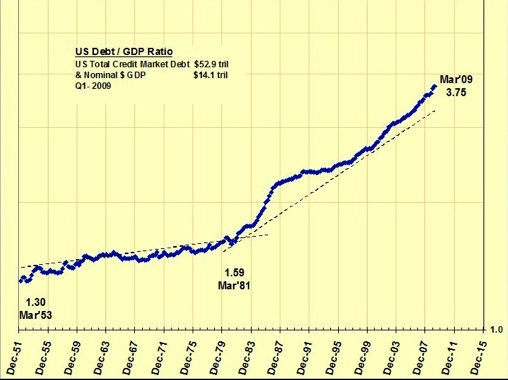
My friend Ian McAvity offers us the following chart, which shows the level of total debt to GDP. It has been rising steadily since 1981 and is now at a ratio of 3.75. Even though consumers and businesses are cutting back on borrowing, the US government is more than making up the difference; so for awhile, at least, we will see total debt to GDP continue to rise. Side note: even with all the money the Fed is printing, M-1 is flat for the last year.
One of the drivers of the growth of the last 30 years has been financial innovation and the ability to increase leverage. Specifically, securitization made it possible to finance a whole array of debt, from credit cards, student loans, and auto loans, to exotic residential mortgages of all kinds, commercial mortgages, corporate bonds, hotel financing, and regular bank loans that were spun out into SIVs and off the banks' books, thereby freeing up capital – and on and on. If it moved, someone could (and did) figure out how to get it into a security and sell it. And it was easy to sell as long as it had a rating from an established rating agency.
Much of this securitization is plain vanilla and a very good thing, as it gives investors a way to get more fixed income. But the rating agencies started using models that were obviously flawed to create the ratings. Massively flawed. Incompetence immortalized in a spreadsheet. When I and others began to write about the problems with CDOs and CDOs squared in 2006, they continued to rate them with the same flawed models. Even when the rules for getting a mortgage changed, they did not change their models. And it isn't that they couldn't have been aware. The TV was rife with ads talking about the various mortgages available, yet the rating agencies used models based on completely different types of mortgages.
And now? If you are sitting at the fixed-income desk at a pension or insurance fund, it is worth your job to take the word of a rating agency. Therefore, securitization is moribund. Will it come back? Yes. But it will take time.
But that is the problem. The world of finance is going to its own New Normal. It will be a world that is less leveraged. The growth in leverage that helped spur growth on the way up is a drag on growth as it is wound down.
Again, it would be highly unusual to see inflation in a deleveraging world. It would be a massive failure on the part of the Fed to allow serious inflation (as in the 1970s) to come back to the levels that some are talking about. I mean, it's possible, but it's far from the most likely outcome.
I had this conversation with Paul McCulley earlier in the year, as we were all deep in the deflation/inflation discussion. He looked at me and said, "John, we better hope the Fed can create some inflation. If they can't, we're in real trouble."
I will write about the current lack of inflation and its future prospects in a future letter; but producer price indexes are way down all over the world, and the CPI (consumer price index) is down year-over-year.
The single most important question for investors to get right over the next few years is whether we face an inflationary or deflationary future. And while there are many who are so positive that they know the answer, and we find people arguing all sides of the issue, I am not persuaded that we have the information we need to make that determination. It could go several ways. My best guess (hope?) is that we get through this bout of deflation and have to deal with some mild, 3-4 % real inflation, not the commodity price-driven kind, which is not monetary inflation. But this will be a multi-year cycle. I will be writing about this for a long time.
Some Thoughts on Secular Bear Markets
Yesterday my good friend Ed Easterling dropped by, as he was in Dallas, down from Portland. Ed co-authored a few chapters with me in Bull's Eye Investing, on secular market cycles. He had a chart that I asked him to get to me for your perusal. The last secular bear market was 1966-82. He charted the ups and down in that market and noted the percentage rises and falls. It was as volatile then as it is now. There were some breathtaking ups and downs. With every rise, pundits declared the end of the bear market, only to have the market fall dramatically again. Take a few moments to gaze at the chart:
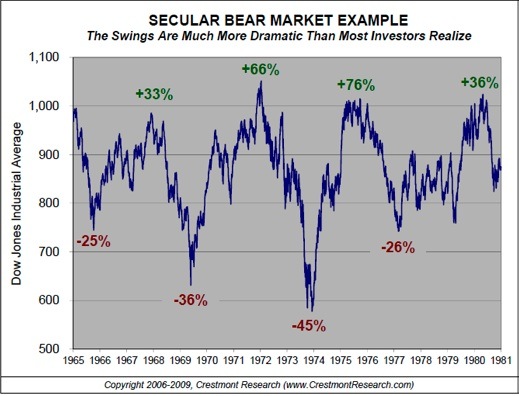
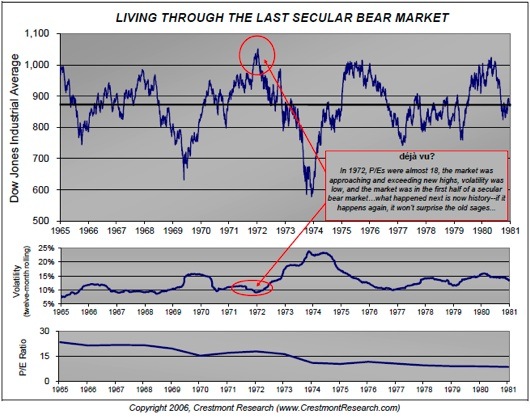
What drives the volatility? My contention is that bull and bear cycles should be seen in terms of valuation instead of price. Markets go from high valuations to low valuations and back to high. It is an age-old story. We have done about half the work we need to do to get back to low valuations. These cycles average of 17 years. We are less than ten years into this one.
I believe we are going to lower valuations in terms of price-to-earnings ratios. This can be done by the market going sideways and earnings rising, or the market dropping, or some combination. Look at the graph below, and notice the slow and steady drop in P/E ratios (bottom chart) and the very volatile markets that accompanied that fall. I agree with Ed; we should not be surprised at today's volatile markets. And we should expect more volatility and large price movements. Both up and down. (Some of the best charts anywhere are at www.crestmontresearch.com.)
John Mauldin is president of Millennium Wave Advisors, LLC, a registered investment advisor. Contact John at John@FrontlineThoughts.com.
Disclaimer
John Mauldin is president of Millennium Wave Advisors, LLC, a registered investment advisor. All material presented herein is believed to be reliable but we cannot attest to its accuracy. Investment recommendations may change and readers are urged to check with their investment counselors before making any investment decisions.
|
|