| Corcoran Technical Trading Patterns For August 24 |
| By Clive Corcoran |
Published
08/24/2009
|
Stocks
|
Unrated
|
|
|
|
Corcoran Technical Trading Patterns For August 24
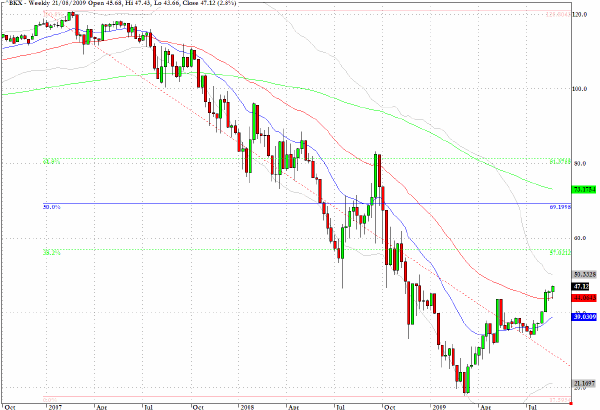
The weekly chart below for the KBW Banking Index (BKX) illustrates the extent of the work still to be done by the banking sector to recover its past glory.
While the recovery since March has been very impressive, it has to be recalled that it was from almost apocalyptically despairing levels.
The technical pattern on the chart remains constructive, but the index would need to climb by almost another twenty percent from current levels to attain the 38% retracement from the 2007 high to the March low.
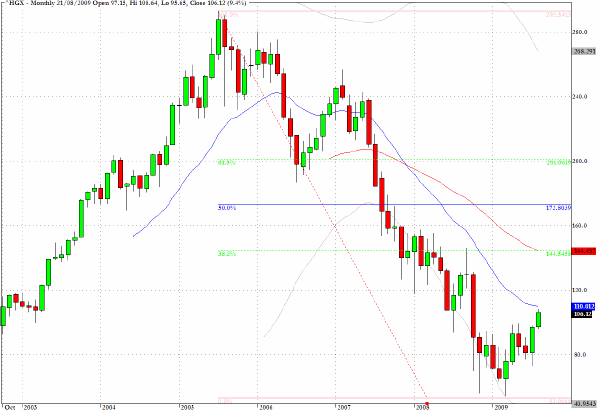
Somewhat similar comments to those made above regarding the banking sector could be applied to the Philadelphia Housing Index (HGX).
The chart below is a monthly chart which is designed to take in the historic peak for this index in mid 2005, and as can be seen from the fibonacci grid, the index would need to move back towards the 144 level for a 38% retracement. This same level also coincides with the 50-month moving average which once again underscores the dramatic fall and the extent of the recovery needed in this vital sector of the US economy.
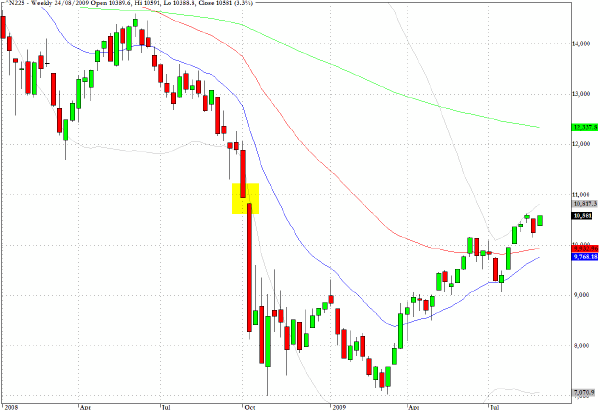
Along with other Asian markets, the Nikkei 225 put in an impressive performance in trading on Monday. A gain of 3.35% was registered, bringing the index almost back to the level seen on August 14.
The index is showing resilience, however, after the setbacks seen last week.
Reviewing the longer-term weekly chart, there can be seen a significant downward gap on the charts just below the 11,000 level which will be the next challenge for this index to face.
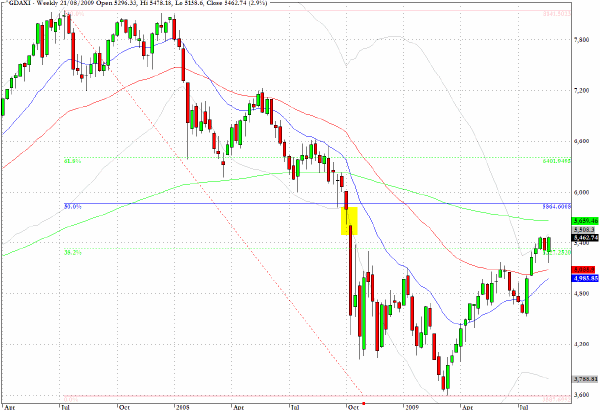
Taking a similar longer-term view of Germany’s DAX index, there is also a highlighted gap from last September/October time frame which will need to be confronted along with the 200-week EMA around the same point on the charts at 5640.
In my commentary last Wednesday morning I suggested that 5150 was a key level from reviewing Tuesday’s intrady hourly chart for the DAX.
This was within eight points of picking the bottom point seen during last week’s trading on this index.
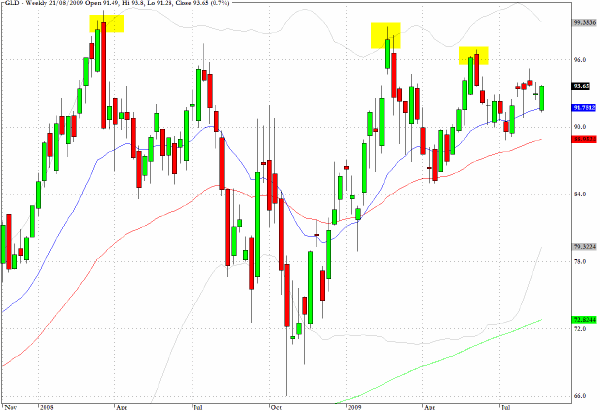
Gold is moving into a fairly critical zone where another lower high would suggest that momentum for the precious metal may be topping out. The pattern on the weekly chart is, however, quite intriguing and it is plausible to make the case that there are a series of nested cup and handle patterns which are ultimately bullish.
This week’s trading should provide us with some strong clues as to the destiny of gold and the US dollar.
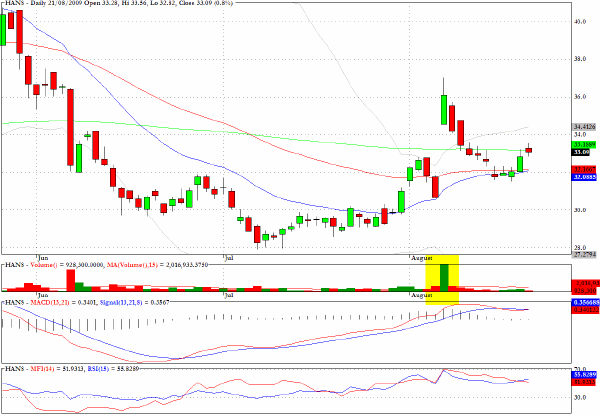
Hansen Natural (HANS) has a relatively bullish looking pullback pattern.
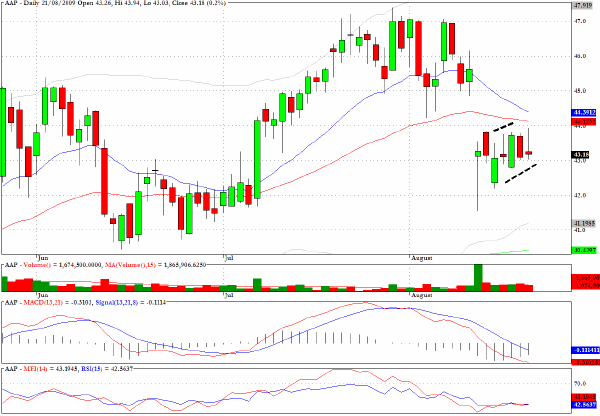
Advanced Auto Parts (AAP) has a clearly developing bear flag pattern.
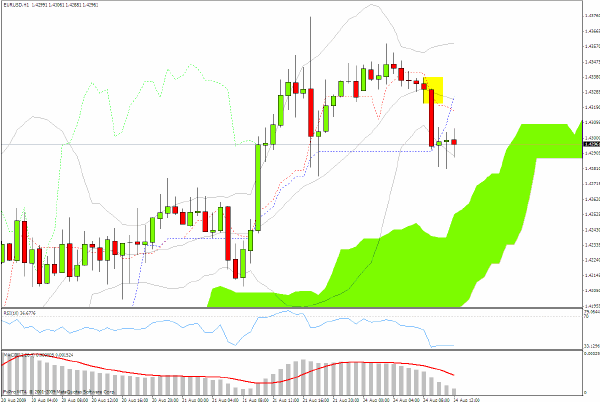
On the hourly charts the EUR/USD provided an Ichimoku sell signal which could see the Eurozone currency move into the green cloud configuration below. This is a short-term signal and should only be considered for action in the current session.
Clive Corcoran is the publisher of TradeWithForm.com, which provides daily analysis and commentary on the US stock market.
|