| Corcoran Technical Trading Patterns For August 27 |
| By Clive Corcoran |
Published
08/27/2009
|
Stocks
|
Unrated
|
|
|
|
Corcoran Technical Trading Patterns For August 27
Apart from some lively action in the EUR/GBP cross rate, there is little to keep one’s attention in the European trading session this morning. Germany’s DAX is moving into a highly constricted pattern on the intraday charts with a too obvious drift to the downside, so one has to be wary of thinking that the game is up for the bulls.
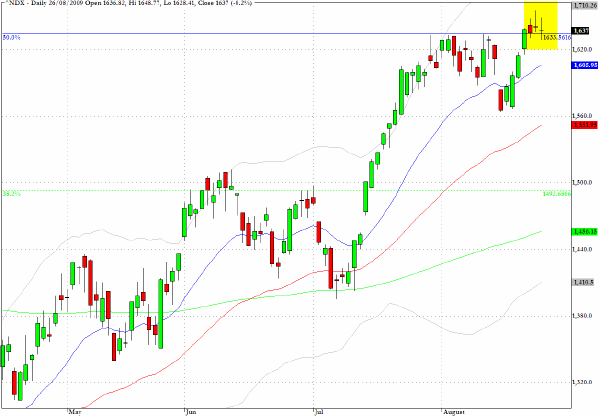
Despite the presence of a succession of indecision candlesticks on the chart for US indices - yet again the Nasdaq 100 registered a doji at almost exactly the 50% retracement level - the market seems to be drifting sideways into the last few days of August.
Perhaps the bears are waiting for one more major flourish about green shoots before they pounce.
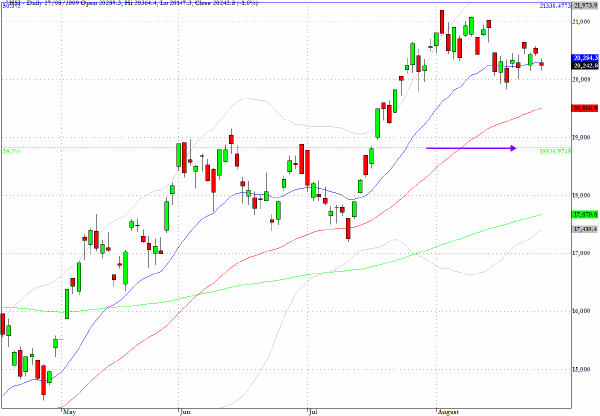
The Hang Seng Index (HSI) is showing more signs that the 50% retracement level at 21,3000 was a stride too far for the near term, and it would not surprise me to see a re-visit to the 19,000 level in coming sessions.
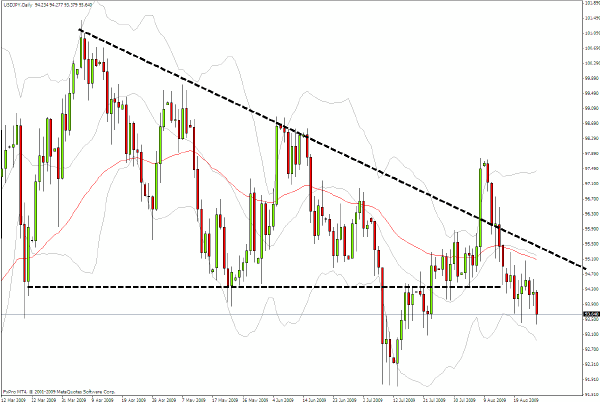
In the currency markets the wedge pattern on the USD/JPY chart is reinforcing my view that some large players are taking up their positions for a return to the risk aversion agenda.
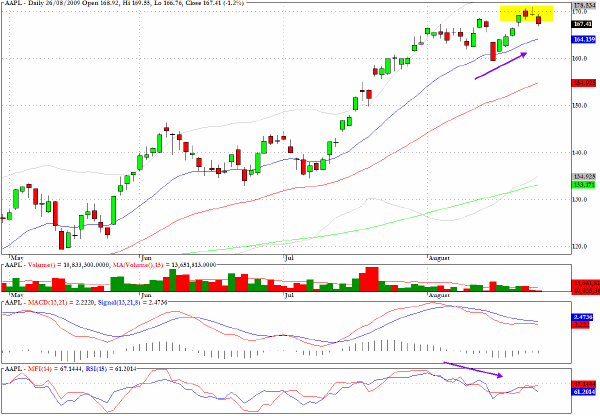
Apple (AAPL) is not a stock that I often comment on since it seems to have almost quasi-religious significance for some, but the current chart pattern is revealing some clear signs of negative divergences.
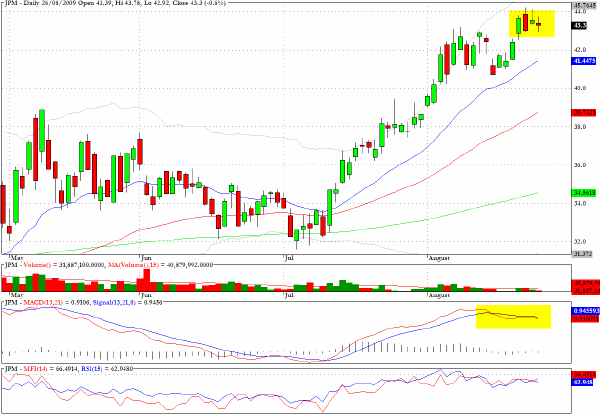
JP Morgan (JPM) also has many fans, but once again the chart does not look inspiring and the reward/risk profiling would suggest that the long side may not be the preferable position at present.
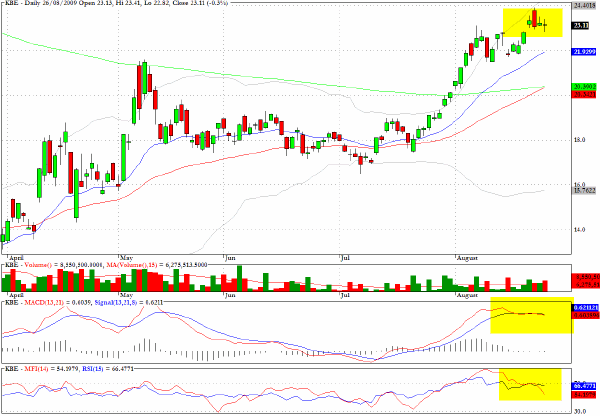
KBE, the exchange traded fund which tracks the KBW Banking Index, is suggesting that, without any obvious earnings sizzle to inspire buyers, the banking sector may have already priced in a lot of the more optimistic mood music.
Clive Corcoran is the publisher of TradeWithForm.com, which provides daily analysis and commentary on the US stock market.
|