| Corcoran Technical Trading Patterns For August 28 |
| By Clive Corcoran |
Published
08/28/2009
|
Stocks
|
Unrated
|
|
|
|
Corcoran Technical Trading Patterns For August 28
As I intimated in my last commentary there were too many carefully laid traps by forex traders and too much enthusiasm from short sellers of S&P 500 futures at the beginning of the session yesterday.
The recovery in equities caused a rather dramatic exiting by the "proto Armageddon" traders in currencies and undoubtedly some trading desks were scrambling to cover bearish currency bets against sterling, the Swiss franc and commodity currencies, which caused a late session plunge in the US dollar index.
The S&P 500 could now shake out the remaining overly anxious short traders and head up to the 1050 level which several equity strategists, including the omniscient GS team, have been targeting.
I'll be watching as September gets started just how the forex markets begin to align again for the anticipated correction in equities and how much the technicals favor their view prevailing the next time around.
I will not publish on Monday as it is a bank holiday weekend in the UK to mark the end of a rather abysmal summer (from a weather point of view that is).
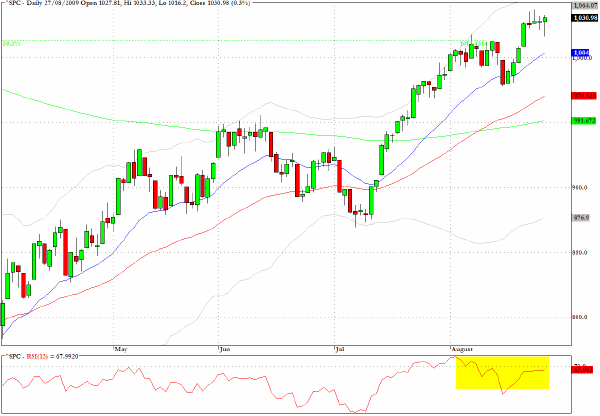
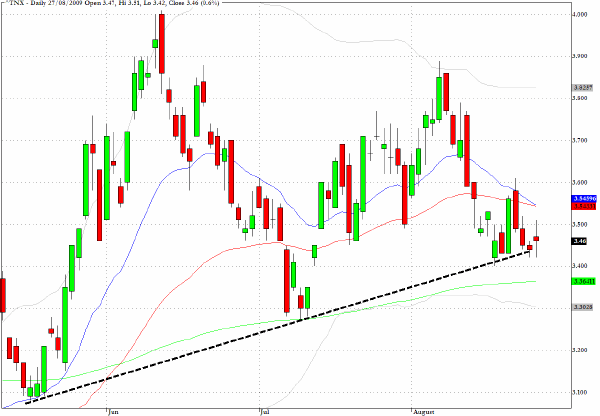
Apart from many forex traders who seem to be very skeptical that the rally in equities can continue, there is a growing suggestion from the Treasury market that yield expectations are deviating from the rosier scenario that is built into improving GDP growth prospects which equity cheerleaders are espousing.
At some point participants in the bond market and the equity market will have to look across the valley and become more in synch with each others' perceptions, because at present they seem to be seeing a very different landscape on the other side.
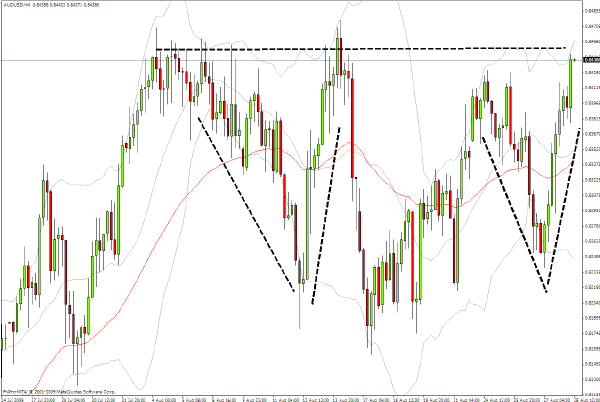
The fast recovery of the Australian dollar was among the first indicators in yesterday’s session that the S&P 500 selling at the open was too contrived.
The currency has recovered since and the 4-hour chart reveals that a key resistance level could be tested and maybe violated in today’s North American session.
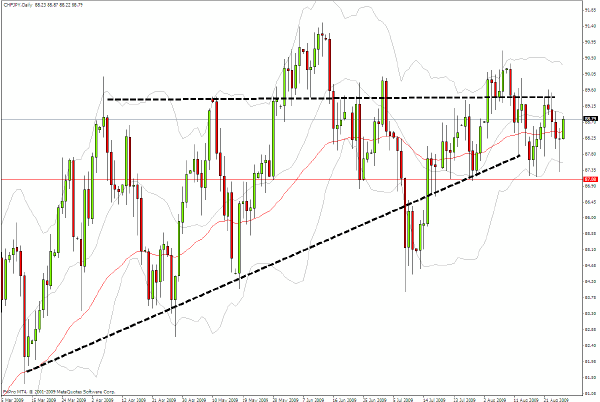
One of the lesser followed currency pairs, CHF/JPY, also scrambled to cover what were clearly bearish bets about US equities, and the chart shows that after threatening to break a key trend-line early in yesterday’s US session, the subsequent pullback toward the top of the range has been quite abrupt.
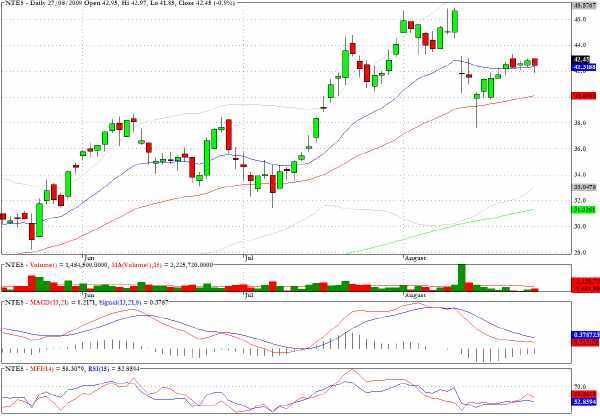
Netease (NTES) could meet resistance at the $44 level.
Corning (GLW) registered a hanging man candlestick pattern just above the 50-day EMA and would be worth monitoring today for signs of weakness.
Clive Corcoran is the publisher of TradeWithForm.com, which provides daily analysis and commentary on the US stock market.
|