NASDAQ COMMENTARY
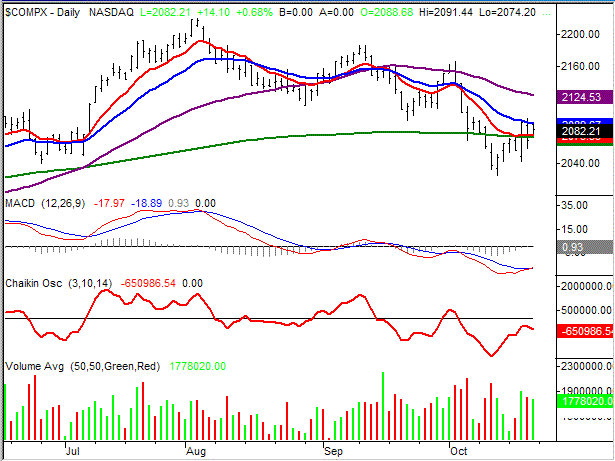
The NASDAQ Composite actually made some nice progress last week, rising from 2064.83 to end the week at 2082.21. That 17.38 point rally was good for a 0.8 percent gain, which isn't bad at all for an expiration week. And more than that, some technical barriers were broken that should give the bulls the advantage now.
Let's just start with the most important items first. As of Wednesday, the index made a close above the 10 day moving average (red) as well as the 200 day moving average (green). So we knew then that there was at least some interest in getting a ra ly started, in the short-term as well as the long-term. Those buy signals were complete by Friday, when those same two moving averages supported the NASDAQ on an intraday basis, and then the close was above them both. That gain was just enough to give us a bullish MACD crossover too, so the bullish hints are quietly increasing in number.
On the bearish side of things, it's clear the 20 day line at 2089.67 is going to be a resistance line. The composite topped out there the last three days of the week. For our money, we'd wait to see if that NASDAQ can actual y break through that line before jumping in with any new long trades.
As for volume, again, we'd have to say the bus won that battle. We started entertaining the idea of a bullish Chaikin line cross (above zero) a week ago, but Thursday unwound that signal line just a tad. But still, there was more buying than selling last week. And even though the volume from Friday was just a hair under Thursday's selling volume, it was still a strong bullish showing for a Friday (when the interest tends to be minimal). Yes, it was an expiration day, which may have prompted a little more volume than usual, but it was still bullish volume.
The only target price we'll mention now is the 50 day line (purple) at 2124, and that would only come into play if and when we can get past the 20 day line. Yeah, it's a minimal expectation, but that's been the nature of the market this year. That same 50 day average ended the September surge petty abruptly, so we're not going to be as trusting this time around. If we can break past it this time, then we'll set a much bigger target.
NASDAQ CHART - DAILY

S&P 500 COMMENTARY
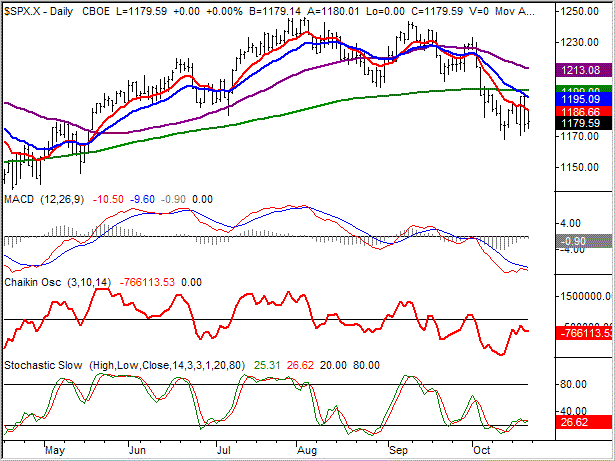
The S&P 500 close at 1179.59 last week was 6.97 points lower than last week's close - good for a 0.6 percent dip. From a momentum (and technical) perspective, that has to be bearish. However, the bulls don't have to completely lose hope here....there are a couple of things that look encouraging, and we still see mixed signals with this chart.
OK, just a quick reality check.....even though we still see a little bullish potential on the SPX chart, as we said above, technically, it's bearish. As such, we have to expect more downside, based on the current chart. On the other hand, there's the 'reality' of the market's personality this year, as well as seasonality.
As for what's bearish, just look at the resistance that the 10 and 20 day lines (red and blue, respectively). On top of that, look at the technical signals that we don't have yet. The NASDAQ managed to make a bullish MACD cross, while the S&P 500 didn't. So, the disciplined side of us has to interpret things as we see them....and that's technically bearish.
Then there's the realist side of us. The market hasn't made any major moves on loooong time, so we find it difficult to believe that we're going to see this short-term downtrend develop into anything longer-term. We were already stochastically oversold, and actually have the green light for a stochastic-based 'buy'. Unfortunately, that's not enough just yet.
The other reality is semi-fundamental. Nearly 2/3 of the S&P 500 companies that have reported earnings so far have actually beat estimates. Eventually, traders and investors alike are going to have to sink their teeth into that. Throw in the fact that this is when the year-end rally usually begins, you just have a lot of potential upside catalysts. That's why we're still leaning on the bullish side of things here, despite the charts. Keep in mind, though, that we still need to see a close above the 20 day line before we get bullish enough to actually act on that opinion.
S&P 500 CHART - DAILY

DOW JONES INDUSTRIAL AVERAGE COMMENTARY
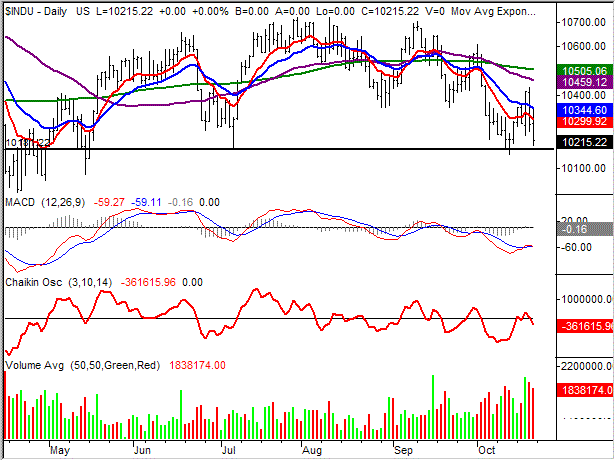
The Dow Jones Industrial Average closed at 10215.22 last week, losing 72.12 points, or 0.7 percent. It was the worst showing of the three major indexes, and an interesting disparity - the Dow had actually offered the most hope for a rally just a few days ago. Then again, the Dow may be the worst proxy for the market; it's a price-weighted average, composed of only 30 stocks. Had it not been for Caterpillar being crushed on Friday (Pfizer and Merck didn't help any either), the Dow Jones Average may have ended the week very differently. For that reason, we're not going to look at this chart too much today.
For the Dow, there's not much going on in the way of bullishness. In fact, about the only interesting things we see are bearish. For instance, the 20 day line (blue) was resistance on Tuesday and Friday. the index managed to trade above that mark on Wednesday and Thursday, but that move never really got any traction. With the close on Friday being the lowest for the week, and the fact that we also hit the week low of 10193.45, we'd also have to say that the Dow ended the week on a bearish note.
The volume story here tells us the same thing. We actually got a bullish Chaikin line cross early in the week, only to have it wiped away with a bearish cross just a couple of days later. We can't exacty preach 'gloom and doom' on the degree of selling we saw on Thursday and Friday, but it was still a relatively high degree of bearish volume. So, there's a substantial lack of buying interest here that tells us these stocks and the index are best left avoided for the time being.
On the other hand, there's been a couple of bounces made at the 10,180 level. While the current momentum here is to the downside, we have to respect that support line.
DOW JONES INDUSTRIAL AVERAGE CHART - DAILY

Price Headley is the founder and chief analyst of BigTrends.com.