| Corcoran Technical Trading Patterns For September 1 |
| By Clive Corcoran |
Published
08/31/2009
|
Stocks
|
Unrated
|
|
|
|
Corcoran Technical Trading Patterns For September 1
Trading was quiet in Europe yesterday as London traders were out celebrating (if that is the right word) the last long weekend of the summer. Foreign exchange was relatively uneventful and the markets did not seem to have too much difficulty digesting the almost 7% fall in Shanghai from Asian trading earlier on Monday (see below).
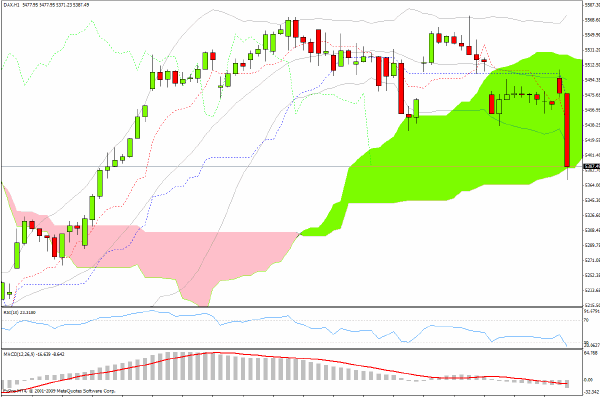
Things are not off to a good start for equity bulls this first morning in September as the DAX is showing a steep fall as indicated on the hourly chart below. The FTSE is also playing catch-up and this will certainly add to some selling pressure when the North American session opens in a few hours time.
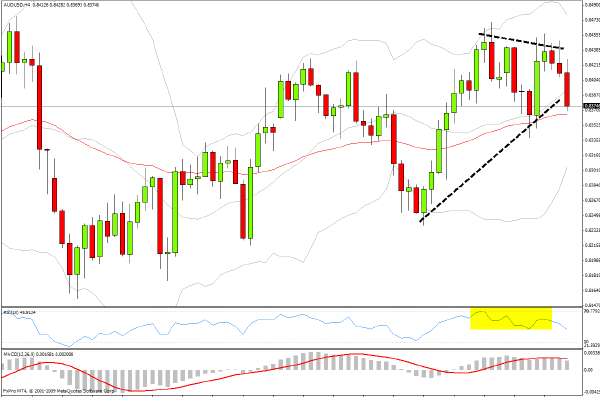
I am still of the opinion that the US dollar is in a rather erratic basing mode at present and if, as I believe, there will be a return to the risk aversion trade during the coming weeks then one of the currency pairs to monitor closely will be the AUD/USD.
The 4-hour chart below shows that a short-term trendline has been violated this morning in the Aussie dollar, and, with other selloffs taking place in sterling, the Canadian dollar and the euro, it will be useful to engage in intermarket analysis over the next few days to see whether the bears, who are surely getting itchy to test lower support levels on the S&P 500, will have the benefit of tailwinds helping along as the dollar gains strength. If the dollar does strengthen today on weakness in US equities, this will act as a rather powerful feedback loop putting more strain on equities, emerging markets and commodities.
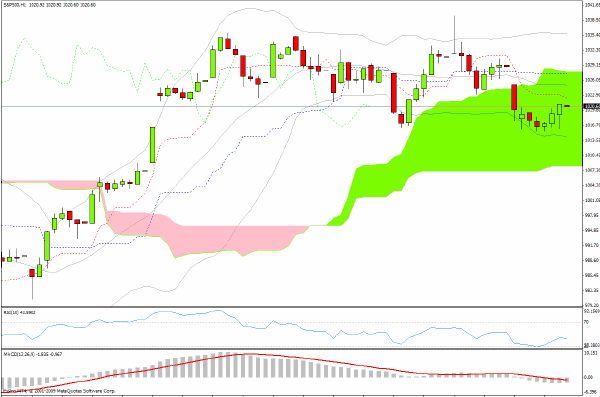
From an Ichimoku chart perspective, the S&P 500 hourly chart shows that the index has moved inside the green cloud zone where price can be expected to behave in a volatile manner where whipsaws are to be expected. There has not been a clear sell signal on a daily basis for the US benchmark index - but it might arise during today’s session.
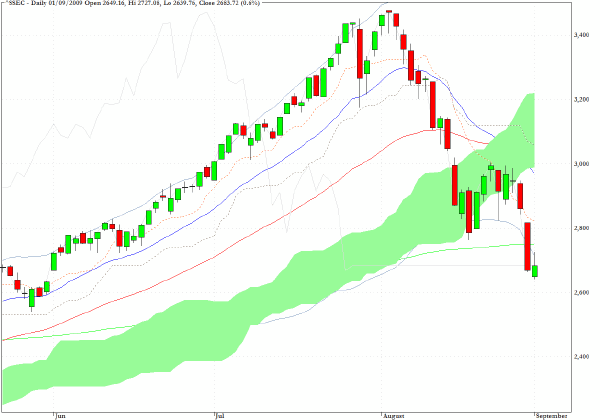
Although it is somewhat old news, I was not around yesterday to comment on Monday’s big fall in Shanghai, but the chart below captures the rather serious nature of the selloff which is unfolding.
The bulls took comfort from the China story during the spring and early summer but now seem to be dismissing the selloff as just a healthy correction. We shall have to wait and see just how healthy it is and whether other markets can remain immune from the fallout.
My suggestion last week that the Hang Seng would see 19,000 in coming sessions has been further validated despite today’s move upwards, in sympathy with a small rebound in Shanghai as illustrated on the chart below.
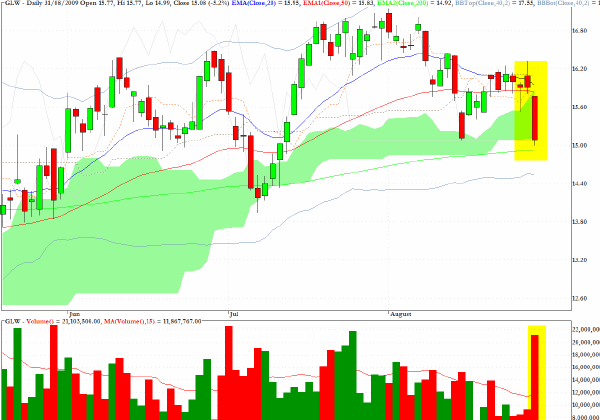
My suggestion last Friday that Corning (GLW) was looking vulnerable delivered a five percent plus return on the short side in yesterday’s action on heavy volume.
From time to time I shall feature the two or three equities and ETF’s that have registered buy and sell signals just based on the modified Ichimoku logic that I have now added to my scanning algorithms.
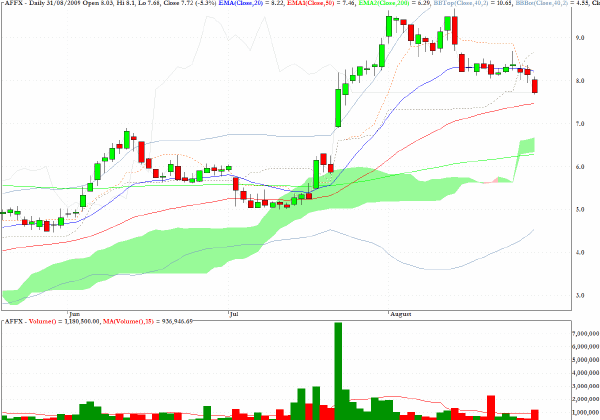
Affymetrix (AFFX) delivered a sell signal last Friday and this can sometimes take a few sessions to find its expression.
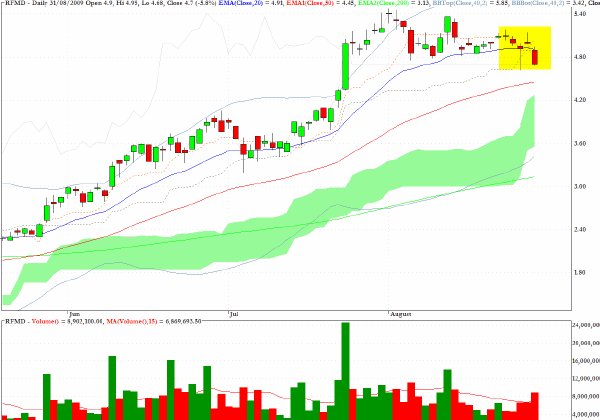
RFMD also issued an Ichimoku sell signal following last Friday’s session.
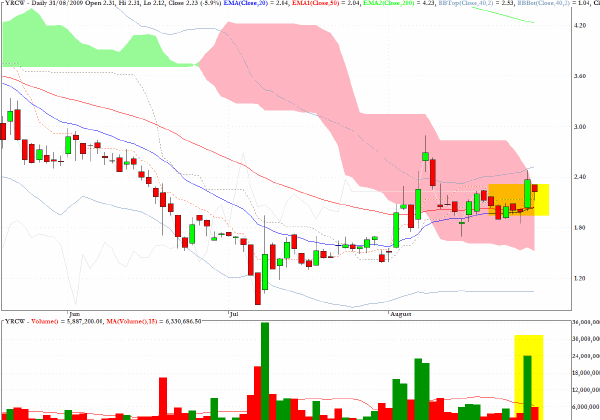
The only buy side signal that I would want to mention for today’s session would be YRCW but this may also suffer in a market downdraft and I would repeat that the signals based on the Ichimoku daily charts tend to lead the market by a couple of sessions on occasion.
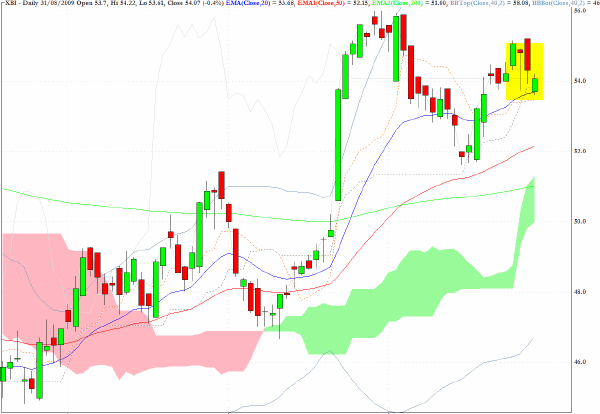
One final suggestion for the short side would be XBI, a sector fund which tracks the biotech sector.
Clive Corcoran is the publisher of TradeWithForm.com, which provides daily analysis and commentary on the US stock market.
|