Thus far, we have been looking at simple indicators, or basic building blocks as I like to call them. In the next few postings, we'll examine the pros and cons, successes and challenges of combining basic system indicators.
We've seen promising biases in breakouts. First, a simple bias suggests strength when the close is above a 40-day moving average, weakness when it's under. Second, a more compound approach looks to go long when the close of the 5-day moving average is greater than the 2-day moving average and vice versa for shorts. Third, the order of extreme high verses extreme low closes also gives us market clues. Specifically, the highest close of the last 50 days should occur before the lowest if you're looking to be a buyer and vice versa. You can review these system indicators in my past columns.
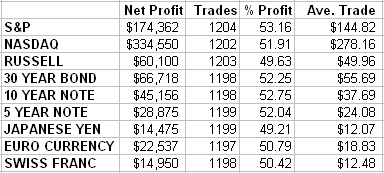
The obvious thing we'd like to observe is a single system following the three aforementioned indicators with a performance result roughly in line with the individual totals added together. The following represents five years.

We're roughly there â€" pretty encouraging considering we haven't done any tampering yet. As you might guess, we can improve the numbers via further optimization in the combined systems, which we'll look at in columns to come.
Art Collins is the author of Market Beaters, a collection of interviews with renowned mechanical traders. He is currently working on a second volume. E-mail Art at artcollins@ameritech.net.