| The McMillan Options Strategist Weekly |
| By Lawrence G. McMillan |
Published
09/3/2009
|
Options
|
Unrated
|
|
|
|
The McMillan Options Strategist Weekly
The bears made a small amount of progress this week, mostly on one large down day on Tuesday. The question becomes, "Is this the beginning of the dreaded, typical September-October meat grinder, or is it just another small overbought correction?" A look at the indicators may help us answer that question.

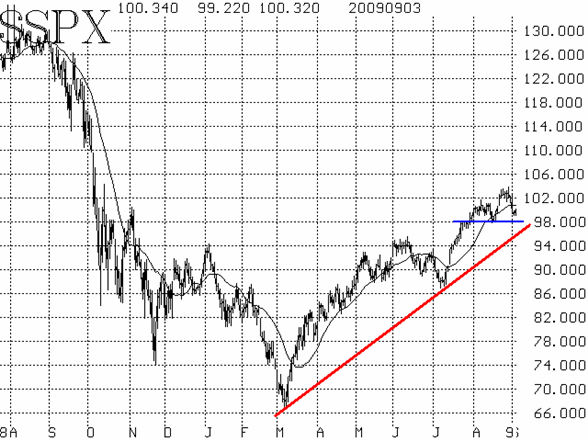
First -- and probably most important -- the $SPX chart remains bullish. The trend line connecting the March and July bottoms is intact. It currently sits at about 965 and is rising daily. That is major support. In addition, there is support at $SPX 980, which is the area of the August lows. So, as long as those two support areas are intact, the $SPX chart remains intermediate-term bullish.

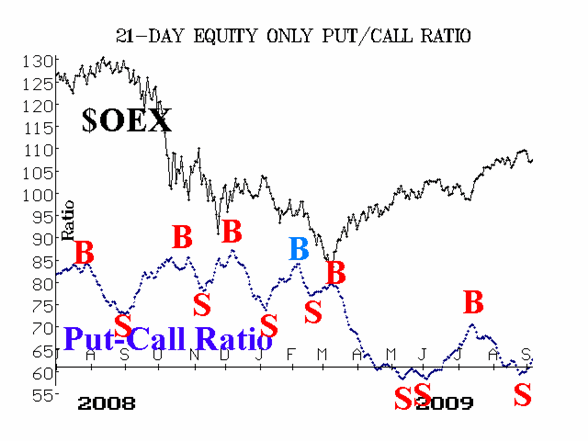
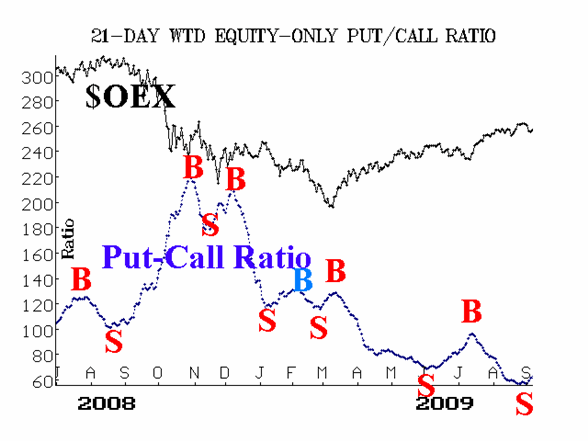
That's the good news. The bad news is that some of the other intermediate-term indicators are on sell signals. Most prominent is the fact that both equity-only put-call ratios are now on confirmed sell signals. This is a major negative factor, as these trusted intermediate-term indicators must be heeded.

Also, market breadth has generated sell signals as well.
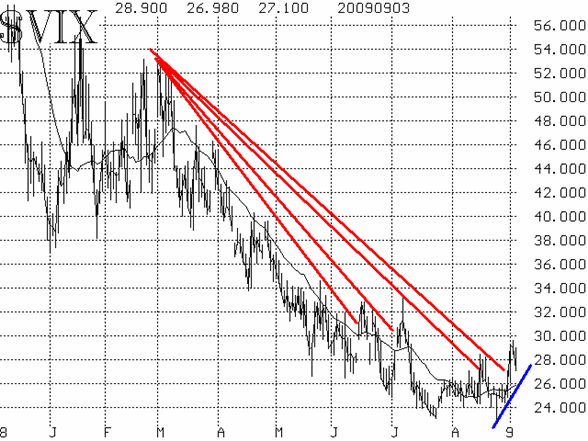
Volatility indices ($VIX and $VXO) have been the object of much discussion in the financial media and elsewhere. $VIX popped higher when the market fell this week and broke through its down trend line. That in itself is a bearish sign for the broad stock market. However, this is the fourth time this year that $VIX has broken a down trend line (see Figure 4) and it failed to hold that breakout the previous three times. So, in reality, the $VIX chart would only be bearish if $VIX is truly trending higher.

In summary, the weight of the evidence is bearish at this time, so we expect the $SPX support in the 970-980 area to be tested. If it gives way, then a more aggressive bearish stance would be warranted.
Lawrence G. McMillan is the author of two best selling books on options, including Options as a Strategic Investment, recognized as essential resources for any serious option trader's library.
|