| Corcoran Technical Trading Patterns For September 11 |
| By Clive Corcoran |
Published
09/11/2009
|
Stocks
|
Unrated
|
|
|
|
Corcoran Technical Trading Patterns For September 11
There are some divergences developing on key FX charts which are pointing to a possible letup in the selling of the US dollar.
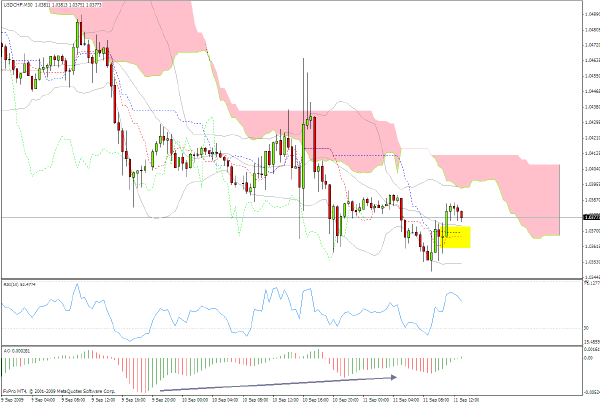
Below is a 30-minute Ichimoku chart of the USD/CHF, and there are suggestions on both the RSI and lower oscillator chart that the successive lower levels are not commensurate with the momentum indicators. In other words, the selling is taking place with less conviction and those carrying short positions against the dollar may be quick to start covering if there is a respite in the market’s current pre-occupation with tempting more investors into risk assets.
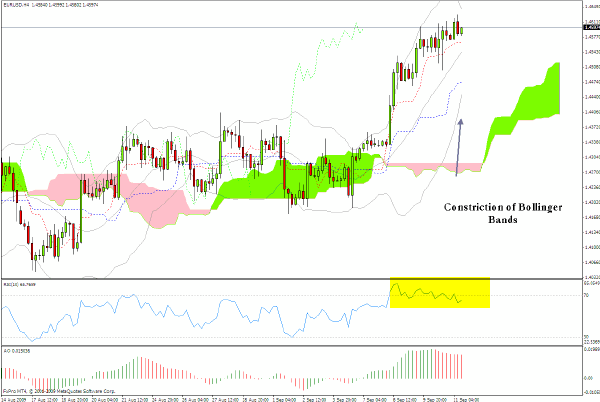
The EUR/USD currency pair (where the USD is the quote currency unlike the above chart where the Swiss Franc is the quote currency) shows the Euro entering a range constriction zone - as evidenced by the narrowing of the Bollinger bands - and where the RSI levels have reached a plateau.
Moving forward on the Ichimoku projection, the cross rate is going to encounter the green cloud within the next few sessions and the dynamics are suggesting that the probability of a corrective pattern is increasing.
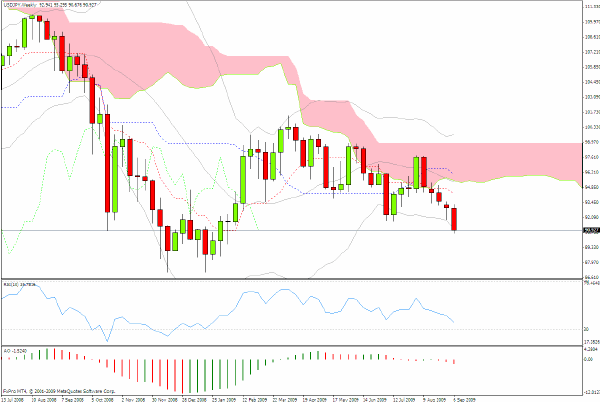
Notwithstanding my general view that the European currencies are at fairly pivotal levels against the dollar, the exception (which maybe proves the rule!) is the USD/JPY pair.
There is a growing sense that the lows seen for the greenback against the yen may now be on the radar with a subsequent strengthening of the Japanese currency. This is also acting as a dampener to the Nikkei and would, based on the notion that many still regard the yen as the primary safe haven currency (especially for Japanese investors), add further plausibility to the notion that there will be some reining back of the "animal spirits" in coming sessions.
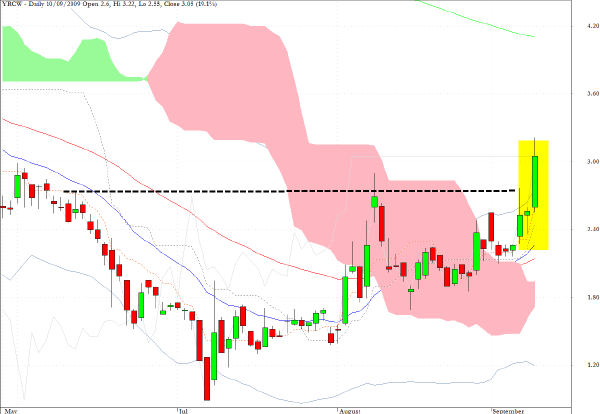
The following was my comment in yesterday’s column about YRCW.
The chart for YRCW is also a followup on a recent recommendation for the long side.
After following through with a definitive rise from the pink cloud following an Ichimoku signal crossover, there is a level of chart resistance which needs to be confronted and if broken would exemplify the requirements of a CANSLIM breakout pattern.
Even though I had recommended a long position earlier in the week there would still have been an ideal opportunity to enter the market on yesterday morning’s open and obtain a 19% return for the session.
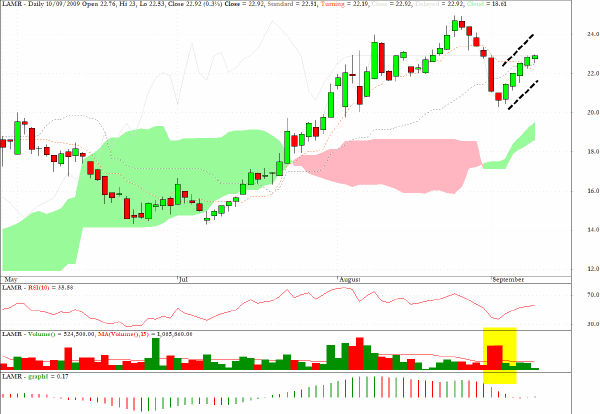
Lamar Advertising (LAMR) has both a bearish flag formation and an Ichimoku daily sell signal.
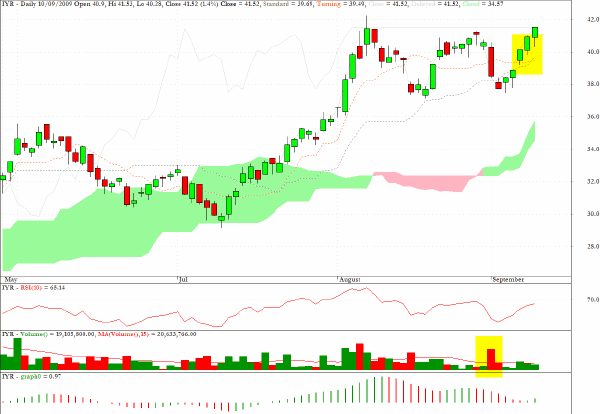
As with LAMR, the sector fund which track US real estate, IYR, has a bearish pullback pattern (especially evident from the volume charts) and also registered an Ichimoku based sell signal on yesterday’s close.
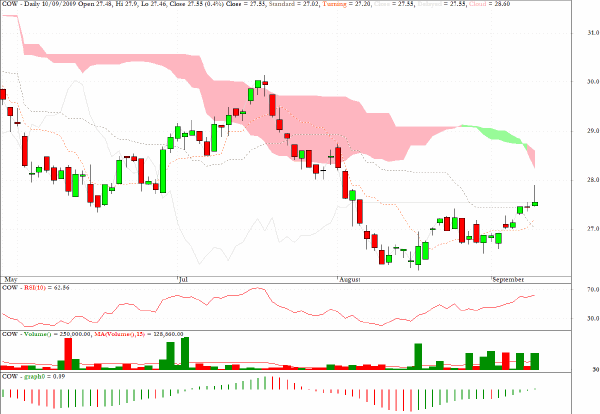
The wonderfully named sector fund, COW, which tracks the livestock sector, appears to be entering a recovery process and even if the immediate outlook is uncertain the chart patterns suggest that, in the medium term, this could make further upside progress.
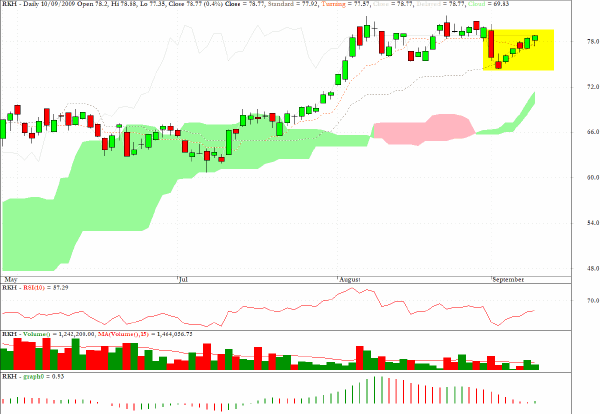
RKH, an exchange traded fund which track regional banks in the US, also has a bearish pullback pattern with an Ichimoku negative crossover following yesterday’s trading.
Clive Corcoran is the publisher of TradeWithForm.com, which provides daily analysis and commentary on the US stock market.
|